- Banking
- Wealth
- Privileges
- NRI Banking
- Treasures Private Client


Related Insights

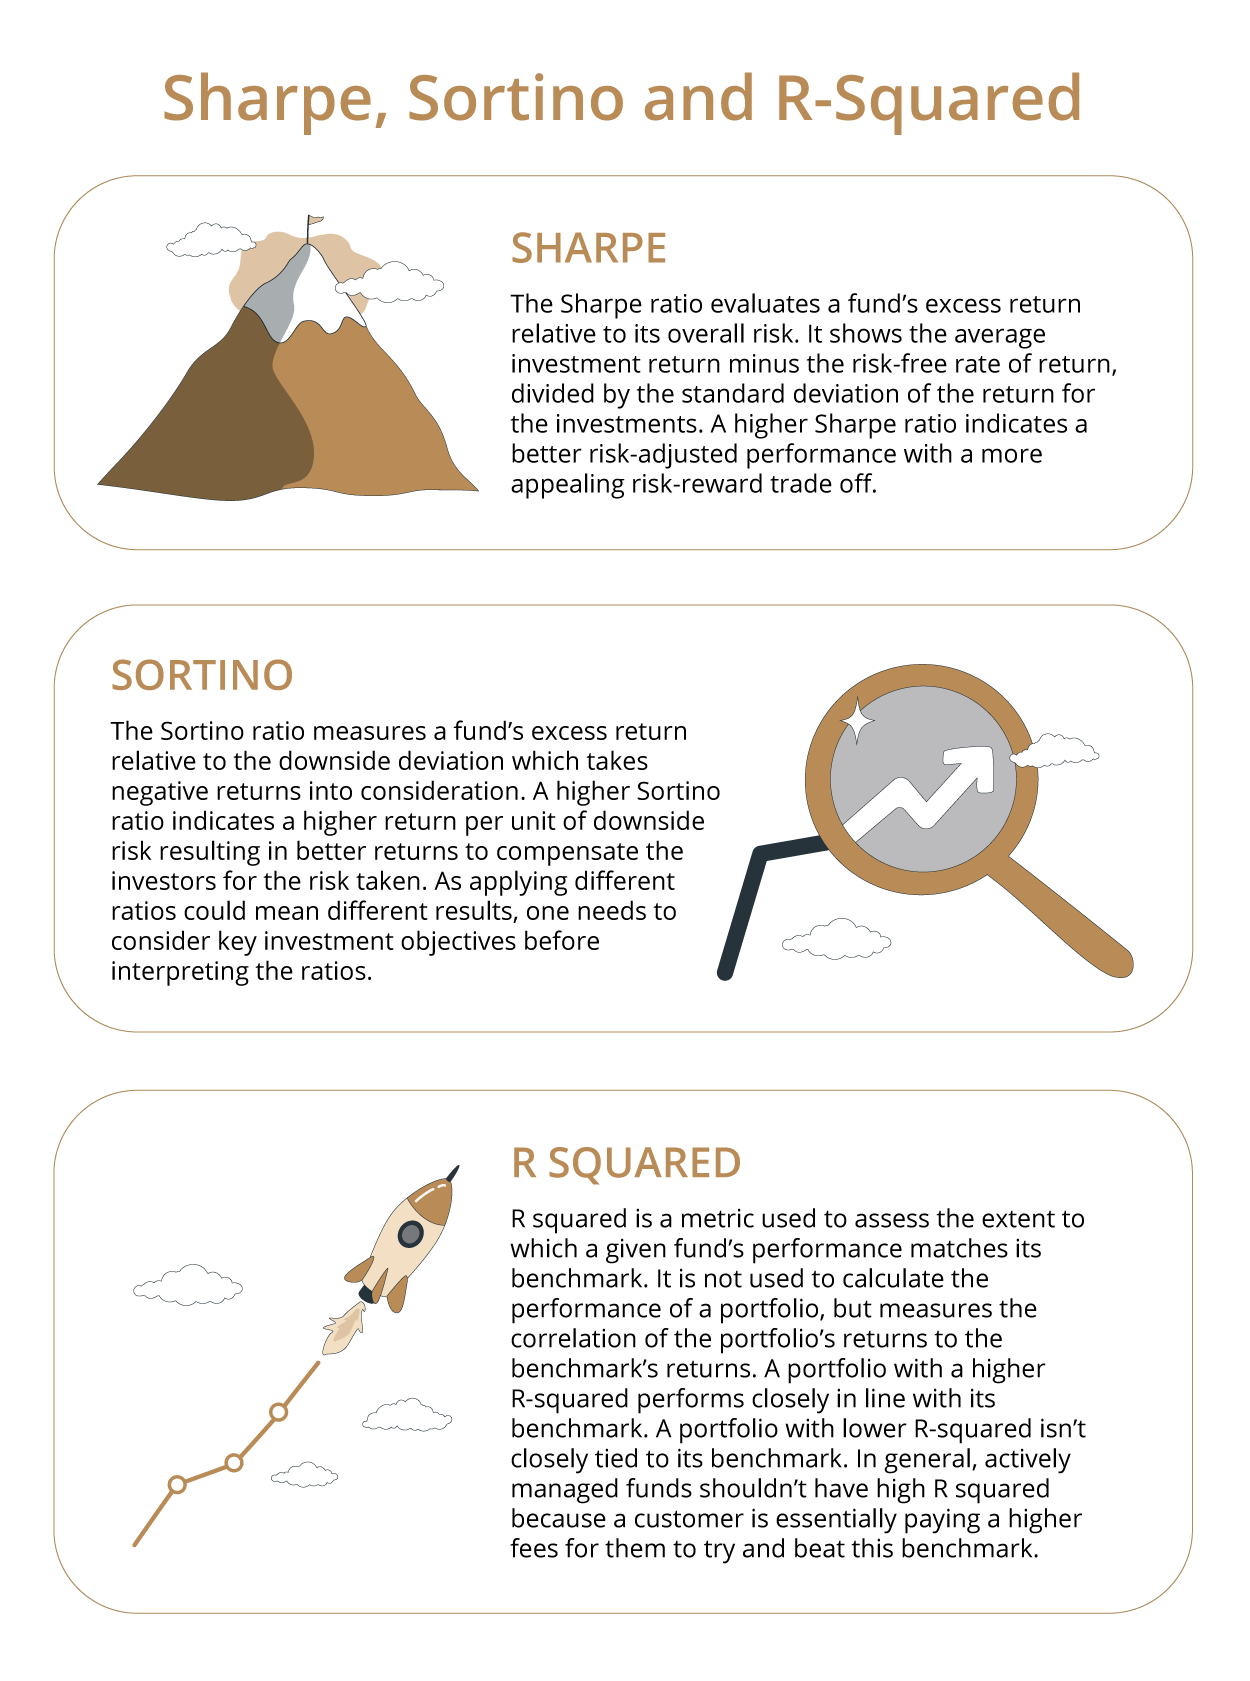
Navigating the world of mutual funds can feel like a daunting task, especially with the huge variety of funds available. Fret not, this simple guide will help you to understand mutual funds ratios better, so that you can make well-informed investment decisions. These ratios offer valuable insights into a fund’s performance, portfolio management and risk profile. There are five key mutual fund ratios: Beta and Standard deviation, which are used for assessing risk, while Sharpe, Sortino and R-squared, are used for measuring risk-adjusted performances. Let’s explore these in more detail.
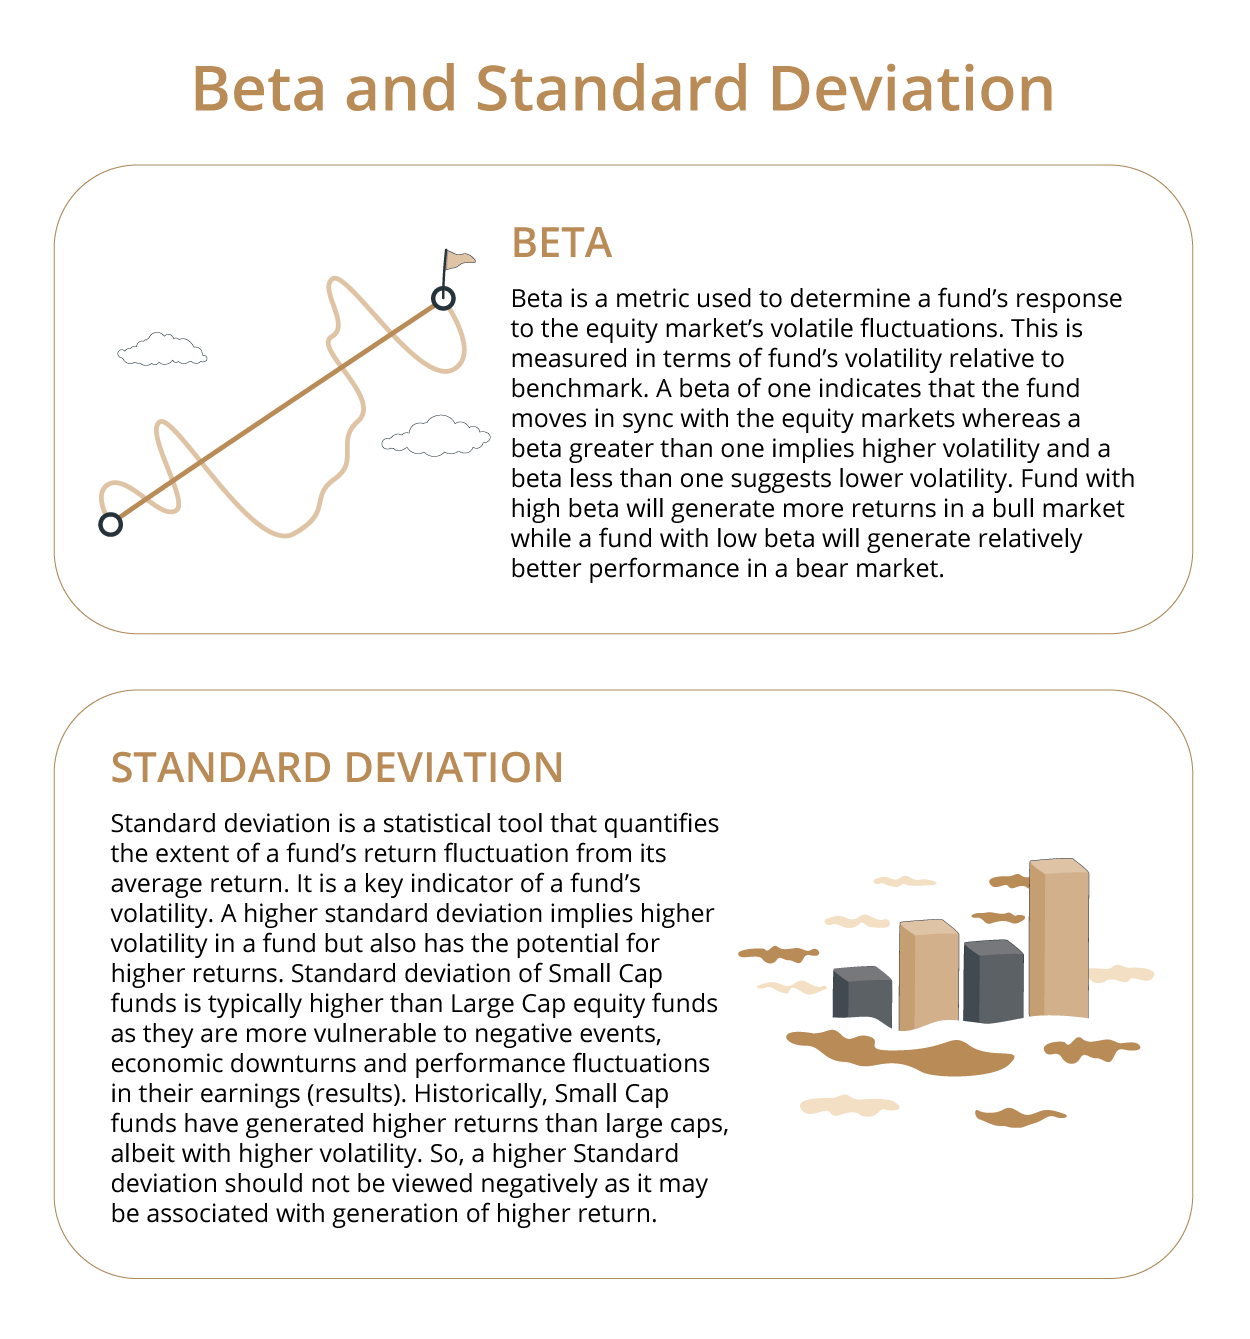
Small Cap funds tend to do well during economic recovery phases, such as when unemployment rates are coming down and businesses are witnessing strong earnings growth. Considering the volatile nature of small cap funds with a higher standard deviation, such funds could be considered for investment by customers with high risk appetite and have a a long-term investment horizon (i.e. at least 5 years and above…)
To summarize this section, Beta is used to measure a fund’s volatility in proportion to it’s benchmark while standard deviation measures the risk of individual funds. With a combination of these two, one can get keen insight into a fund’s risk profile.
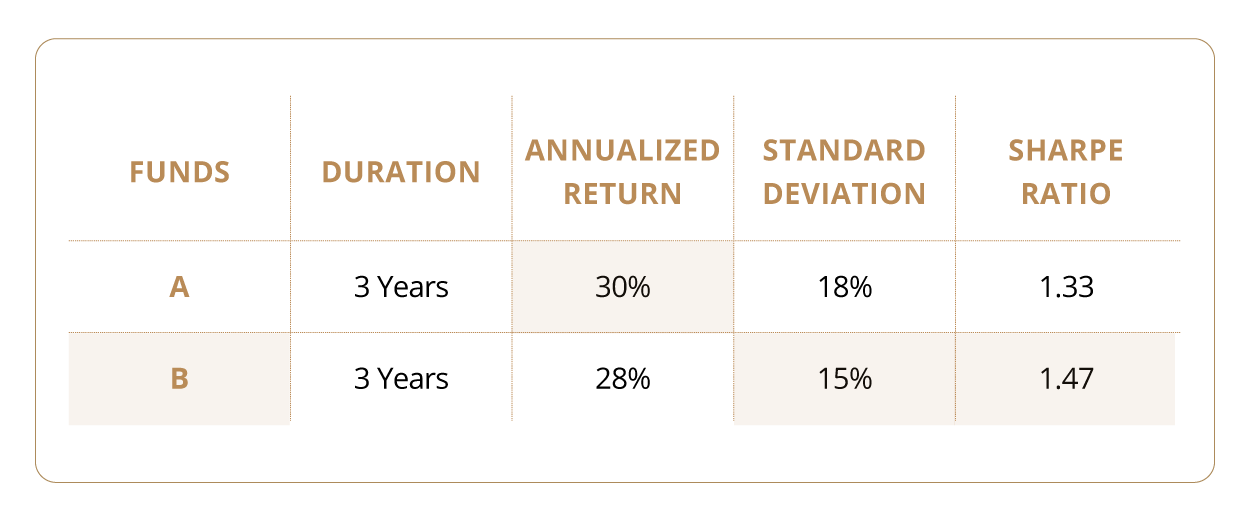
Consider an illustration to analyse two funds over a three-year period, typically considered for equity segment. Fund A and Fund B generated annualized return of 30% and 28% respectively. Volatility measured by Standard Deviation was higher for Fund A at 18% compared to 15% for Fund B on an annualized basis. Assuming a risk-free rate of 6%, Sharpe Ratio of Fund A was 1.33 while it was higher for Fund B at 1.47. Despite Fund A’s higher returns, Fund B outperformed on a risk-adjusted basis owing to its higher Sharpe Ratio.
An in-depth understanding of mutual fund ratios is an extremely valuable skill for anyone seeking to make sound investment decisions. If examined and utilised well, these performance measurement tools will enable better fund selection and ensure superior performance for investor’s portfolio.
The ultimate aim for an investor is to achieve his or her financial goals. That is where DBS Select comes in. As a trusted guide, DBS Select is committed to leading the investor to a more secure financial future by incorporating financial ratios and other proprietary research tools to generate mutual fund options specifically based on their risk appetite and financial objectives. Remember, you are not alone in this investment journey, with a keen understanding of financial ratios and support from sophisticated financial tools such as DBS Select will ensure your money works harder for you.
Know More articles on mutual funds products to diversify your investment portfolio.
DBS Select our funds fact sheet, with curated information on equity, debt, hybrid, gold and ULIP funds.
Download Now digibank by DBS Application to access these ratios via the mutual fund section.
Topic
Explore more
Wealth FeedThis article is for information purposes only. We recommend you get in touch with your investment advisor for any financial advise.
Mutual Fund investments are subject to market risks, read all scheme related documents carefully.
DBS Bank India Limited – AMFI registered Mutual Fund Distributor (ARN-155319)