- Banking
- Wealth
- Privileges
- NRI Banking
- Treasures Private Client


Related Insights

If you’ve only got a minute:
- Do not rely solely on share price performance when deciding on which company to invest in.
- When evaluating a company, it is important to judge if it has consistent revenue growth, consistent earnings growth, healthy net profit, positive operating cash flow, a healthy and consistent current ratio, a low debt/equity ratio, and a high and consistent return on equity.
- While this isn’t an exhaustive list, it does give you a good understanding of how to get started and always remember to do your due diligence.
A common mistake that new and even intermediate stock pickers tend to make is to focus only on a company’s stock price and rely solely on it to make investment decisions.
Much like how you wouldn’t make important decisions that affect your life by consulting only 1 friend or family member, using stock prices in isolation is not reliable in determining whether you should invest in a particular company.
So, how do you determine if a company will make a good investment?
What you should really do is to look at a company as a whole: its business model, scalability and sustainability, core fundamentals, and financials before you even consider its share price performance.
As you will be using your hard-earned savings, it is imperative to do your due diligence when investing. This includes taking the time to research several stocks in the same industry, as well as having a broad view on the outlook of the markets they operate in.
While such information is readily available and mostly free, most of us have full-time jobs and juggle other responsibilities, which means our main constraint is time.
Thankfully, there are some metrics that we can easily use to evaluate which companies to invest in. What’s more, all this can be done in the comfort of your home and without specialist software.
Consistent revenue growth
A key measure of a company’s success is its ability to record revenue that grows year-on-year.
Revenue is the amount of money a company receives from its normal business operations (i.e. the selling of their products/services). Revenue is also referred to as sales. It is calculated as the average sales price multiplied by the number of units sold.
For example, if company X sells 10,000 bags, each at a price of INR 100 in 2022, its revenue for that year is:
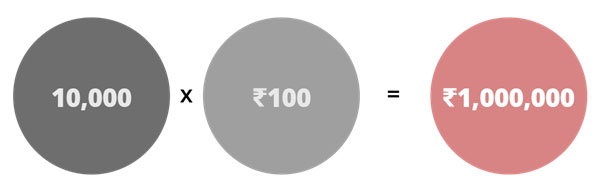
If company X sells 11,000 bags in 2023 while maintaining the sales price of its bags, it will record a revenue of INR 1.1 million for the year, a revenue growth of 10%. This suggests that there is an increasing demand for company X’s bags.
You want to look for:
A company that has a history of consistent revenue growth for the last 3 to 5 years or more. The reason behind this is simple. You want to invest in a company that is able to grow and make more money over time.

Consistent growth in net profit
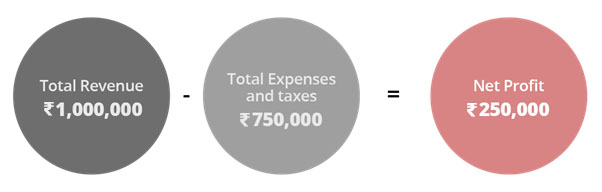
Net profit (or net income or earnings) is the amount of money a company retains after deducting total expenses (i.e. costs of sales general expenses) and taxes from its revenue.
A higher net profit can mean that a company has more cash to distribute to its shareholders as dividends or invest in new business opportunities.
If company X makes INR 1 million in revenue and has total expenses and taxes of INR 750,000 for the year, its net profit would be:
Net profit is important because a company can have large growing revenues but still be unprofitable. This can happen if its costs are rising faster than its revenues.
You want to look for:
A company that has a history of consistent earnings growth for the last 3 to 5 years or more. By definition, a company that has growing revenues and stable profit margins should have its net profit growing in tandem as well.
High, consistent net profit margin
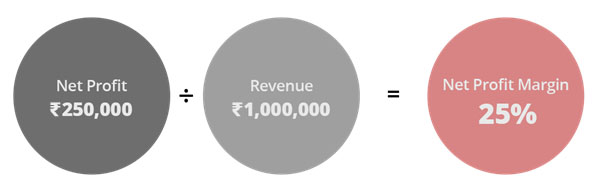
Net profit margin measures how much of each rupee of a company’s revenue translates into profit. In other words, it is the company’s ratio of net profit to revenue.
Using the same example, if company X’s revenue is INR 1 million and net profit is INR 250,000, then its net profit margin would be:
Investors can use net profit margin to measure if a company is generating sufficient profit from its business activities and whether its operating costs and overheads are managed.
You want to look for:
When analysing companies from the same industry, you should pick out those with higher net profit margins compared to its peers. A higher profit margin is indicative of a more profitable and cost-efficient company.

Positive operating cash flow (OCF)
OCF is the amount of cash generated by a company’s normal business operations. Cash flow is extremely important because it indicates whether a company is able to generate enough cash to stay in business.
Let’s go back to our example. Company X has revenues of INR 1 million and total expenses and taxes of INR 750,000 in a year.
But if it can only collect INR 600,000 in payment for the bags it sold, it means its business operations do not generate enough cash to cover its total expenses. In other words, it would have a negative cash flow of INR 150,000.
In this case, if company X doesn’t have enough cash reserves or can’t borrow the money to cover its total business expenses, there is a good chance it will go bankrupt!
You want to look for:
A company that generates positive operating cash flow and has a history of consistent OCF growth that grows in tandem with its revenue and profit.
High, consistent current ratio
The current ratio or working capital ratio measures a company’s ability to pay its short-term obligations (i.e. those due within 1 year) with its current assets. The higher the ratio, the more capable the company is of fulfilling this.
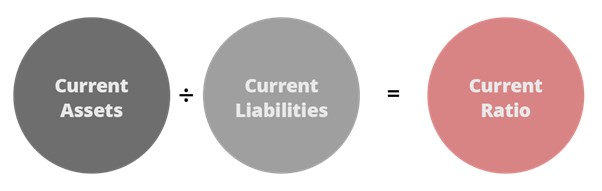
A current ratio of less than 1 means that a company might have difficulty paying its short-term obligations when they become due, which is not a sign of good financial health.
You will want to make comparisons:
When using this ratio to analyse a company, it is important to compare it with its peers instead of those of other industries. This is because there are different acceptable ranges for current ratios, depending on the industry.
If a company has a lower current ratio than the industry average, it might be indicative of a higher risk of distress or default. Meanwhile, a very high current ratio compared with its peers might signal that a company isn’t using its assets efficiently.

Low debt/equity ratio
The debt/equity ratio is used to evaluate a company’s financial leverage by comparing its total liabilities to its total shareholder equity. The higher the ratio, the more aggressive a company is in financing its business operations using debt.
Most people put their guard up the moment debt is mentioned. But in business, debt is fairly common. What is key is whether a company’s debt is manageable.
Debt can increase shareholders’ returns as the company uses it to finance bigger business operations to potentially generate more revenue and profit in future.
However, the increase in earnings must outweigh the cost of the debt’s interest payments. It can become risky if a company borrows too much debt and its business operations don’t go as planned and profits take a hit. This can sometimes lead to bankruptcy.
Understandably, the lower the amount of debt, the easier it can be managed and the less risk a company carries. The higher the debt, the more risk a company has.
In general, you should be a little wary if a company has a debt/equity ratio of more than 1.5 and you might want to ask some hard questions of a company with a ratio of 2 or above.
You want to make comparisons:
You can use this ratio to compare a company with its peers in the industry to get a clearer picture of what is acceptable or good. For example, capital-intensive industries tend to have higher ratios, while a service-base industry might have lower ratios.

High, consistent Return on Equity (ROE)
ROE measures how much profit a company generates with the money shareholders have invested. The higher the ratio, the better the company is at generating profit on its shareholders’ funds.
ROE is one of the more important ratios you should pay attention to. Your chance of making money on a stock over the long-term should be higher with companies that consistently generate high ROEs.
You want to make comparisons:
The long term average ROE for Indian companies has varied between 13%-16% across different time periods(Pre-Covid, Post Covid), but there are wide differences between the industries. FMCG sector MNCs and large Indian IT companies have high ROE (over 30%) while those involved in capital intensive business like telecom and oil have low ROEs (below 10%).
This is why it is important to consider each company’s ROE relative to its industry peers.
How about dividends?
While dividends are considered one of the most tangible ways to reap the benefits from investing, many tend to ignore the overall aspects of a company’s fundamentals as they focus primarily on the value of dividends they can receive.
This can be myopic if investors are only focusing on high dividend yields without other considerations. When it comes to dividend investing, there are an additional set of metrics to consider.
Topic
Explore more
Wealth FeedThis article is for information purposes only. We recommend you get in touch with your investment advisor for any financial advise.
Mutual Fund investments are subject to market risks, read all scheme related documents carefully.
DBS Bank India Limited – AMFI registered Mutual Fund Distributor (ARN-155319)