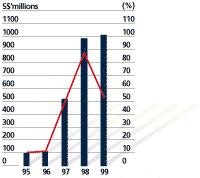
Group Provisions and Provisions as Percentage of Operating Profit
| Of the total provisions made by the Group in 1999, S$763.4 million in specific provisions were related to DTDB, S$122.8 million for loans to the Regional Countries (excluding DTDB) and S$191.6 million for loans to Singapore and other countries' borrowers. All classified loans have been fully provided for. The decline in ratio was due to the higher operating profit in 1999. |
 |
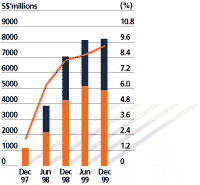
Group Total Non-Performing Loans (NPLs) & NPLs as Percentage of Total Loans
| Out of the total NPLs of S$8,149.0 million, S$4,529.8 million (56%) were secured by collateral; and S$4,951.5 million (61%) were in the substandard category. |
 |
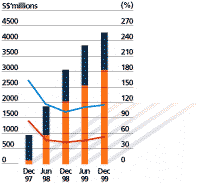
Group Cumulative Specific & General Provisions as Percentage of Unsecured NPLs
| Group total cumulative provisions at end-December 1999 amounted to S$4,285.9 million, representing a provision coverage of 118% of unsecured NPLs. |
 |
| In 1999, DBS Bank issued US$750 million of subordinated term debt qualifying as Tier 2 capital. Together with profit retained for the year, the total Capital Adequacy Ratio (CAR) of the Group at end-December 1999, measured according to the Bank of International Settlements (BIS) guidelines was 19.2%, more than twice the minimum BIS' requirement. The overall CAR is managed with a view to providing flexibility for business expansion as well as optimising return on equity over the medium term.
|