|   |  


                      |   Performance At A Glance - DBSH Group    


                          |   |  
                            |  
                          2001 |  
                          2000 |  
                          1999 |  


  |  
                           
                          
                          | PROFIT AND LOSS (S$millions) |  
                           
                          
                          |   |  
                          Operating profit |  
                          1,672 |  
                          1,685 |  
                          1,964 |  
                           
                          
                          |   |  
                          Net profit attributable to members |  
                          999 |  
                          1,389 |  
                          1,072 |  
                           
                          
                          |   |  
                          Cash basis net profit attributable to members |  
                          1,131 |  
                          1,389 |  
                          1,072 |  
                           
                         
                          |   | 
                           
                          
                          | BALANCE SHEET (S$millions) |  
                           
                          
                          |   |  
                          Total assets |  
                          151,294 |  
                          111,208 |  
                          106,465 |  
                           
                          
                          |   |  
                          Customer loans |  
                          68,208 |  
                          52,024 |  
                          54,370 |  
                           
                          
                          |   |  
                          Customer deposits |  
                          106,771 |  
                          80,720 |  
                          82,268 |  
                           
                          
                          |   |  
                          Total shareholders?funds |  
                          13,529 |  
                          10,495 |  
                          10,876 |  
                           
                         
                          |   | 
                           
                          
                          | PER ORDINARY SHARE (S$) |  
                           
                          
                          |   |  
                          Earning (Basic) |  
                          0.78 |  
                          1.13 |  
                          0.97 |  
                           
                          
                          |   |  
                          Cash Earning (Basic) |  
                          0.89 |  
                          1.13 |  
                          0.97 |  
                           
                          
                          |   |  
                          Gross dividend |  
                          0.30 |  
                          0.45 |  
                          0.26 |  
                           
                          
                          |   |  
                          Net tangible assets backing |  
                          5.38 |  
                          8.14 |  
                          8.42 |  
                           
                         
                          |   | 
                           
                          
                          | SELECTED RATIOS (%) |  
                           
                          
                          |   |  
                          Return on average total shareholders?funds |  
                          8.90 |  
                          12.89 |  
                          10.35 |  
                           
                          
                          |   |  
                          Cash return on average total shareholders?funds |  
                          10.07 |  
                          12.89 |  
                          10.35 |  
                           
                          
                          |   |  
                          Operating expenses as % of net income 1 |  
                          49.12 |  
                          42.50 |  
                          35.15 |  
                           
                          
                          |   |  
                          Capital adequacy |  
                           
                          
                          |   |  
                          Tier I |  
                          12.20 |  
                          14.40 |  
                          15.70 |  
                           
                          
                          |   |  
                          Total |  
                          17.40 |  
                          18.90 |  
                          19.20 |  
                           
                         
                          |   | 
                           
                          
                          |   |  
                          1 Excluding goodwill amortisation |  
                           
                        
                               Financial Highlights    


                          (S$ millions)
   |  
                            |  


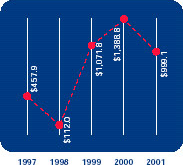
                              | Group Net Profit After Tax |  
                               
                             
                              |   |  
                              
                              
                              |  |  
                               2001: S$999.1 million (-28.1%)  2000: S$1,388.8 million  |  
                               
                             
                              |   | 
                               
                              
                              |  Group net profit decreased 28.1% to S$999.1 million largely due to higher loan provision. When measured on a cash basis, Group net profit decreased by 18.6% to S$1,130.5 million.  |  
                               
                            
                              |  
                           
                         
                          |   | 
                           
                         
                          |   | 
                           
                          
                          (S$ millions)
   |  
                            |  


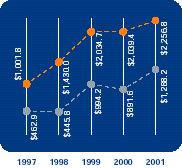
                              | Group Net Interest Income And Non-Interest Income |  
                               
                             
                              |   |  
                              
                              
                              |  |  
                               Net Interest Income   2001: S$2,256.8 million (+10.7%)   2000: S$2,039.4 million  |  
                               
                              
                              |  |  
                               Non-Interest Income  2001: S$1,288.2 million (+44.5%)  2000: S$891.6 million  |  
                               
                             
                              |   | 
                               
                              
                              |  Net interest income increased by 10.7% to S$2,256.8 million largely due to the acquisition of Dao Heng Bank Group (DHG). Loan demand was weak and intense competition in the residential mortgage market reduced interest earned on mortgages.  |  
                               
                             
                              |   | 
                               
                              
                              |  The 44.5% increase in non-interest income was due to higher net gains on foreign exchange (S$110.8 million), securities and derivatives activities (S$71.1 million) and inclusion of profits from sales of shares in The Insurance Corporation of Singapore Ltd (S$120.1 million) and Keppel Capital Holdings (S$60.6 million).  |  
                               
                            
                              |  
                           
                         
                          |   | 
                           
                         
                          |   | 
                           
                          
                          (S$ millions)
   |  
                            |  


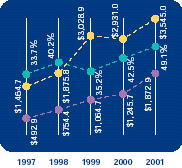
                              | Group Income Before Operating Expenses, Operating Expenses And Ratio of Operating Expenses To Income Before Operating Expenses |  
                               
                             
                              |   |  
                              
                              
                              |  |  
                               Income Before Operating Expenses  2001: S$3,545.0 million (+20.9%)  2000: S$2,931.0 million  |  
                               
                              
                              |  |  
                               Operating Expenses  2001: S$1,872.9 million (+50.4%)  2000: S$1,245.7 million  |  
                               
                              
                              |  |  
                               Ratio of Operating Expenses to Income Before Operating Expenses*  2001: 49.1% (+6.6 percentage points)  2000: 42.5%  |  
                               
                             
                              |   | 
                               
                              
                              |  Operating expenses, excluding goodwill amortisation, increased 39.8% to S$1,741.5 million. The increase was mainly due to higher staff costs of S$120.8 million and the consolidation of DHG (S$218.4 million) and DBS Vickers Securities Holdings Pte Ltd (DBSV) (S$37.6 million). Technology-related expenses increased by S$47.6 million accounted for by the various business initiatives undertaken by the Group. Restructuring and integration costs of S$40.4 million were incurred for integrating the operations and processes of DHG (S$18.7 million), DBS Kwong On Bank (S$4.9 million) and DBSV (S$16.8 million).  |  
                               
                             
                              |   | 
                               
                              
                              |  * Excluding goodwill amortisation  |  
                               
                            
                              |  
                           
                         
                          |   | 
                           
                         
                          |   | 
                           
                          
                          (S$ billions)
   |  
                            |  


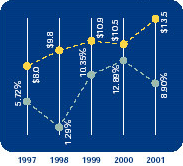
                              | Group Total Shareholders?Funds And Return On Average Total Shareholders?Funds (ROE) |  
                               
                             
                              |   |  
                              
                              
                              |  |  
                               Total Shareholders?Funds  2001: S$13.5 billion (+28.9%)  2000: S$10.5 billion  |  
                               
                              
                              |  |  
                               ROE  2001: 8.90% (- 3.99 percentage points)  2000: 12.89%  |  
                               
                             
                              |   | 
                               
                              
                              |  On a cash basis, ROE would be 10.07% for Year 2001.  |  
                               
                            
                              |  
                           
                         
                          |   | 
                           
                         
                          |   | 
                           
                          
                          (S$ billions)
   |  
                            |  


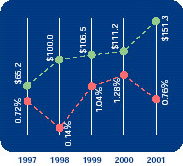
                              | Group Total Assets And Return On Average Total Assets (ROA) |  
                               
                             
                              |   |  
                              
                              
                              |  |  
                               Total Assets  2001: S$151.3 billion (+36.0%)  2000: S$111.2 billion  |  
                               
                              
                              |  |  
                               ROA  2001: 0.76% (-0.52 percentage points)  2000: 1.28%  |  
                               
                             
                              |   | 
                               
                              
                              |  The consolidation of DHG contributed to the increase in total assets.  |  
                               
                             
                              |   | 
                               
                              
                              |  On a cash basis, ROA would be 0.86% for Year 2001.  |  
                               
                            
                              |  
                           
                         
                          |   | 
                           
                         
                          |   | 
                           
                          
                          (S$ billions)
   |  
                            |  


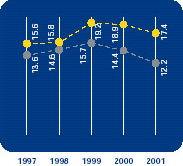
                              | Capital Adequacy Ratio |  
                               
                             
                              |   |  
                              
                              
                              |  |  
                               Total (Tier I & II)  2001: 17.4%   2000: 18.9%  |  
                               
                              
                              |  |  
                               Tier I   2001: 12.2%  2000: 14.4%  |  
                               
                             
                              |   | 
                               
                              
                              |  Total CAR, measured according to the Bank of International Settlements (BIS) guidelines was 17.4%, which is more than twice the minimum BIS requirement of 8.0%.  |  
                               
                            
                              |  
                           
                        
                              |  
                       
                      
                      |   |  
                       
                      
                            |  
                       
                    
                      |  
                    |  
                   
                     |  
                    |