How We Measure Long-term Performance
Engaging Multiple Stakeholders
Our actions are guided by a long-term perspective and the interests of our stakeholders – shareholders, customers, employees, regulators and society. To this end, we have a balanced scorecard that measures our performance against our strategy. The Group’s balanced scorecard is cascaded throughout the organisation; the performance goals of every business, market and support function are aligned to those of the Group.
SHAREHOLDERS
Our shareholders expect superior and sustainable returns commensurate with their risk appetite, with profits earned in a responsible manner.
CUSTOMERS
To differentiate ourselves in an industry as commoditised as banking, we must put our customers at the centre of all that we do. This means anticipating our customers’ needs as well as offering better products, a superior experience and greater convenience.
EMPLOYEES
People are at the heart of banking and we are committed to being an employer of choice.

REGULATORS
We believe we can contribute to the stability of the financial system by engaging regulators and industry bodies to shape the development of policies. We actively participate in forums to do so.
SOCIETY
Our role in society goes beyond corporate citizenship and philanthropy. We believe we have a much broader social purpose – to create long-term economic value through responsible banking to enhance the communities we serve.
DBS’ BALANCED SCORECARD
The scorecard is divided into two parts of equal weighting. Specific objectives for each part are updated every year and approved by the Board. Specific key performance indicators (KPIs) are in place to track the progress made in serving the interests of shareholders, customers and employees. KPIs relating to regulators and society are embedded in our scorecard and cut across all aspects of our operations. As we operate in a regulated industry, upholding regulatory requirements is paramount and underlies all our decisions and actions. We recognise the importance of serving society at large and are committed to giving back to the community.
The top part of the scorecard comprises KPIs set for the current year. Shareholder metrics measure the financial results achieved and include income growth, expense-related ratios and return on equity. We measure risk-related KPIs to ensure that the Group’s income growth is balanced against the level of risk taken. Control and compliance KPIs are also a focus in this section. Customer metrics measure the Group’s achievement in increasing customer wallet share and satisfaction. Employee KPIs, such as employee engagement, training, mobility and turnover, seek to measure the progress we have made in being an employer of choice.
The bottom part of the scorecard sets out the initiatives we intend to complete in the current year as part of our longer-term journey towards achieving our strategic objectives. Specific KPIs and targets are set for our nine priorities and other areas of focus. Our ability to meet the current-year targets in the first part is dependent on successfully executing the second part in preceding years.
BALANCED SCORECARD APPROACH
 |
Shareholder | Customer | Employee |
|
Achieve sustainable growth
|
Position DBS as Bank of Choice
|
Position DBS as Employer of Choice
|
 |
Geographies | Entrench leadership in Singapore |
| Reposition Hong Kong | ||
| Rebalance geographic mix of our business | ||
| Regional businesses | Build a leading Small and Medium Enterprise (SME) Banking business | |
| Strengthen wealth proposition | ||
| Build out transaction banking and treasury customer businesses | ||
| Enablers | Place customers at the heart of the banking experience | |
| Focus on management processes, people and culture | ||
| Strengthen technology and infrastructure platform | ||
| Other areas of focus | Scale up institutional investor and western MNC businesses | |
| Build a leading Asian fixed income business | ||
| Leverage innovation to extend customer reach and offer differentiated client experience | ||
| Champion social entrepreneurship in Singapore and across Asia |
SELECTED KPIs IN OUR SCORECARD
TRADITIONAL KPIs (50% WEIGHTING)
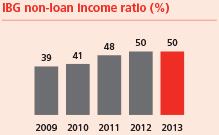
Non-interest income and net interest income at new highs
of 45% or better
positive 3% pt income-expense jaws after three years of franchise investments
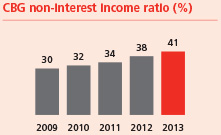
non-loan to total income ratio was maintained and Consumer Banking (CBG) non-interest income ratio rose
| Customer satisfaction scores* | 2012 | 2013 |
| Wealth Management customer engagement score | 3.81 | 4.02 |
| Consumer Bank customer engagement score | 3.71 | 3.86 |
| Large corporate bank ‘core bank’ score | 59% | 65% |
| SME bank customer engagement score | 4.03 | 4.05 |
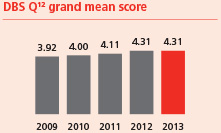
a possible 5. We were awarded the Gallup Great Workplace Award 2013 for
the high level of engagement
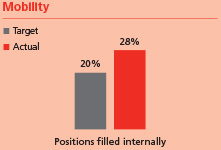
and personal growth
markets. More than one-quarter of positions filled internally in 2013
STRATEGIC PRIORITIES (50% WEIGHTING)
Excluding regional trading income booked in Singapore, the core domestic franchise
posted double-digit percentage growth in income and earnings
to capture the benefits of Hong Kong-China connectivity and the growing affluent
customer segment
India to achieve a more balanced geographic mix
income at new highs; tempered by the macroeconomic environment in India

Asian wealth management proposition
and deepening relationships

GROUP PROFIT AND LOSS SUMMARY
| 2013 | 2012 | % chg | |
|---|---|---|---|
| Selected income statement items (SGD m) | |||
| Net interest income | 5,569 | 5,285 | 5 |
| Net fee and commission income | 1,885 | 1,579 | 19 |
| Net trading income | 1,095 | 689 | 59 |
| Other income | 378 | 511 | (26) |
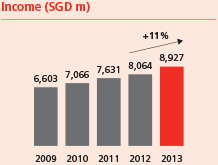
| Total income | 8,927 | 8,064 | 11 |
| Expenses | 3,918 | 3,614 | 8 |
| Profit before allowances | 5,009 | 4,450 | 13 |
| Allowances for credit and other losses | 770 | 417 | 85 |
| Profit before tax | 4,318 | 4,157 | 4 |
| Net profit | 3,501 | 3,359 | 4 |
| One-time item (Gain from sale of BPI) | 221 | 450 | (51) |
| One-time item (DBS Foundation) | (50) | – | NM |
| Net profit including one-time items | 3,672 | 3,809 | (4) |
| Selected balance sheet items (SGD m) | |||
| Customer loans | 248,654 | 210,519 | 18 |
| Total assets | 402,008 | 353,033 | 14 |
| Customer deposits | 292,365 | 253,464 | 15 |
| Total liabilities | 364,322 | 317,035 | 15 |
| Shareholders’ funds | 34,233 | 31,737 | 8 |
| Key financial ratios (%) (excluding one–time items) | |||
| Net interest margin | 1.62 | 1.70 | – |
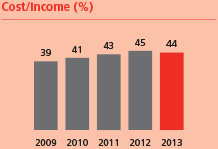
| Cost/income ratio | 44 | 45 | – |
| Return on assets | 0.91 | 0.97 | – |
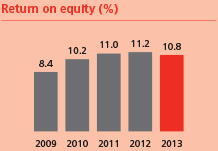
| Return on equity1 | 10.8 | 11.2 | – |
| Loan/deposit ratio | 85 | 83 | – |
| NPL ratio | 1.1 | 1.2 | – |
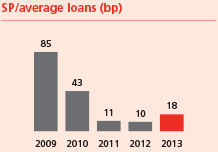
| Specific allowances (loans)/average loans (bp) | 18 | 10 | – |
| Common Equity Tier 1 capital adequacy ratio2 | 13.7 | – | – |
| Tier 1 capital adequacy ratio2 | 13.7 | 14.0 | – |
| Total capital adequacy ratio2 | 16.3 | 17.1 | – |
| Per share data (SGD) | |||
| Per basic share | |||
| – earnings excluding one–time items | 1.43 | 1.39 | – |
| – earnings | 1.50 | 1.57 | – |
| – net book value | 13.61 | 12.96 | – |
| Per diluted share | |||
| – earnings excluding one–time items | 1.42 | 1.37 | – |
| – earnings | 1.48 | 1.56 | – |
| – net book value | 13.51 | 12.86 | – |
| 1 | Calculated based on net profit attributable to the shareholders net of dividends on preference shares and other equity instruments. Non-controlling interests, preference shares and other equity instruments are not included as equity in the computation of return of equity |
| 2 | With effect from 1 January 2013, Basel III capital adequacy requirements came into effect in Singapore. Changes due to Basel III affected both eligible capital and risk-weighted assets. Unless otherwise stated, capital adequacy disclosures relating to dates prior to 1 January 2013 are calculated in accordance with the then prevailing capital adequacy regulations and are thus not directly comparable to those pertaining to dates from 1 January 2013 |

FINANCIAL PERFORMANCE OVERVIEW
Net profit rose to a record SGD 3.50 billion for 2013. Including one-time items, net profit was SGD 3.67 billion.
Record operating performance
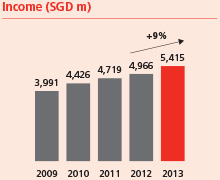
Total income increased 11% to a new high of SGD 8.93 billion, propelled by higher loan volumes and broad-based non-interest income growth. The double-digit top-line growth reflected the depth and resilience of our regional franchise in a year marked by market volatility.
Net interest income rose 5% to a record SGD 5.57 billion. Loans increased 18% or SGD 38 billion to SGD 249 billion, led by regional trade loans, Singapore corporate borrowing and secured consumer loans. While the net interest margin of 1.62% was eight basis points below the previous year due to lower average loan spreads and yields on securities, it was stable during the course of the year with little quarterly fluctuations.
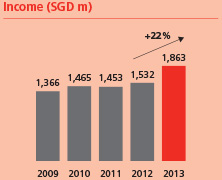
Non-interest income increased 21% to a record SGD 3.36 billion. Fee income rose 19% to SGD 1.89 billion. All fee segments grew by double-digit percentage terms, with contributions from wealth management and transaction banking services reaching new highs. Stockbroking commissions and investment banking income benefited from stronger capital market activity, particularly in the first half. Other non-interest income increased 23% to SGD 1.47 billion as higher treasury customer income and trading gains were partially offset by lower income from investment securities.
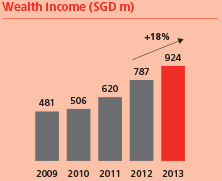
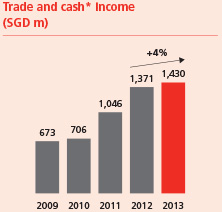
By customer segments, Wealth Management income increased 18% to SGD 924 million and SME Banking income grew 11% to SGD 1.37 billion. By product lines, income from treasury customer activities rose 19% to SGD 1.04 billion, accounting for a record 50% of total Treasury income from 44% in the previous year. Income from Global Transaction Services increased 5% to SGD 1.48 billion as double-digit percentage increases in trade loans and cash management deposits were offset by lower rates.
Institutional Banking and Consumer Banking / Wealth Management, the two customer-facing business units, respectively accounted for 52% and 28% of the group’s total income. The remaining 20% was attributable to other activities, including balance sheet management, market making, and investment and trading gains.
Expense growth was contained at 8% to SGD 3.92 billion, giving a positive jaw of three percentage points. The cost-income ratio improved to 44% from 45% a year ago.
Profit before allowances increased 13% to cross SGD 5 billion for the first time. The stronger operating performance was partially offset by higher general and specific allowances. Total allowances rose 85% to SGD 770 million. General allowances increased in line with stronger loan growth while specific allowances rose to 18 basis points of loans from exceptionally low levels a year ago.
One-time items amounted to SGD 171 million, comprising a gain of SGD 221 million for the partial divestment of a stake in the Bank of the Philippine Islands less a sum of SGD 50 million set aside to establish the DBS Foundation to further our commitment to social and community development.
Balance sheet remains strong
Asset quality remained healthy. The non-performing loan rate was little changed from recent quarters at 1.1%. Allowance coverage was at 135% and at 204% if collateral was considered.
Liquidity continued to be ample. Deposits grew 15% or SGD 39 billion during the year to SGD 292 billion, in line with loan growth, and the loan-deposit ratio was maintained around recent quarters’ levels at 85%. Three-fifths of the deposit growth during the year was in US dollars from western multinational corporations, institutional investors and other customers.
The Group was also well capitalised, with a total capital adequacy ratio of 16.3% and a Common Equity Tier-1 ratio of 13.7%.