- Banking
- Wealth
- Privileges
- NRI Banking
- Treasures Private Client

- India’s exports notched a record high in the last fiscal year
- Few segments might prove resilient, even as overall export pace loses momentum
- Net terms of trade gauge is moderating
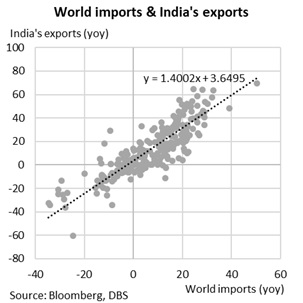
- Global demand matters more than the currency to determine exports
- A wide trade deficit will keep the current account north of 3% of GDP this year

Related Insights
- China chartbook: 2Q24 GDP growth tracking 5%25 Apr 2024
- Research Library25 Apr 2024
- Bank Indonesia’s proactive hike 24 Apr 2024

For the full report with charts please download the PDF file
Record goods exports and imports in FY22, pace softening of late
India’s exports had recovered sharply, up 20% from pre-pandemic level as of Jun22, outpacing the domestic engines - consumption and investment growth. The share of exports in growth has also returned to a seven year high of over 21%, playing a bigger supportive role.
Nominal merchandise exports rose to a record high of US$422bn in FY22 (year ending Mar22), up 45%yoy. Comparatively, before Covid, the value of exports had stagnated around $300bn between FY16 to FY20. Last year’s internals reveal that while part of the lift can be put to post-Covid recovery, there are concerted shifts in the product mix which might see some strength sustain. Imports also added up to record high at $613bn in FY22 on a notably larger commodity bill, including crude oil and coal. By extension, the annual trade deficit rose to a record at $191bn, more than double from year before.
In first half (Apr-Sep22) of FY23, exports totalled $224bn, a run-rate that would place full year exports at a record $430bn. Imports stood at $377bn in first six months of FY23, potentially leaving annual purchases at north of $700bn, also a record. If we assume a slower run-rate for exports in 2H on global growth slowdown and imports moderating on softer commodity prices, the trade deficit will register a record of ~$300bn in FY23, double of FY21-FY22 average.
The evolving net terms of trade index, which shows the relative price of exports vs imports, signals that import prices are growing faster than exports as readings slip below 100.
Internals
India’s exports product mix has broadened, led by high value products in the past two years compared to the previous five years.
Besides Covid-driven segments (e.g., pharma, services etc.), engineering, project goods, electronics etc. have also increased their footprint. Manufacturing goods which make two-thirds of the total rose 37%yoy in FY22, driven largely by engineering goods, chemicals, pharma, plastic, textiles, and related products. Electronics is a small part of overall shipments (<5%), but jumped 41%yoy last year, punching above its weight.
Petroleum exports, the second key contributor, benefited from higher oil and refined product prices, rising a sharp 161%yoy. In addition to regular imports, private refiners reportedly[1] tapped discounted supplies from Russia and aggressively boosted fuel exports, whilst public sector players were contracted to purchase under the pre-signed annual supply deals.
Put differently, when classified as labour-intensive/ traditional and manufactured sectors, the latter has led the surge export growth in the past two years (see chart), while labour-intensive industries remained relatively flat. Higher presence of finished goods, besides push from Production Linked Scheme (PLI), and commodity price gains contributed to this outperformance.
These segments started FY23 on a strong note, but barring petroleum shipments, others are slowing, pulling down headline exports. Concurrently, demand from key trading partners is also coming under pressure. As of Sep22, purchases by US, EU, Gulf, ASEAN as well as China have either contracted or slowed, compared to double digit growth last year.
The next question that arises is whether the strength in exports can sustain. Several regulatory support as well as shifts in the global trade environment provide opportunities for India to widen its export footprint. While the short-term trend will be beholden to global demand cycles, an emerging better mix of product lines, including electronics, drugs and pharma, speciality chemicals etc., compared to a more traditional basket (gems and jewellery, textiles, plastics, wood, and products etc.) is expected to lend some extent of resilience to the export trend in the medium term. This set against the backdrop of a reorientation towards a larger manufacturing presence (e.g., fiscal incentives like PLI), core push like One District One Product (ODOP), infrastructure focus, global like China + 1 Strategy (success story on certain Apple manufacturing processes), clean energy (solar modules etc.) and groundwork on free trade agreements, bode well for the external sector.
Imports and commodities
Import growth outpaced exports in FY22 and continues its strong stride into FY23. Amongst the top ten segments - Apr-Aug22 (first five months of FY23) purchases were led by 89% yoy increase in petroleum/ oil, followed by 30% increase in electronics, 174% jump in coal, 41% in chemicals and 28% in iron & steel, whilst gold purchases fell 12.5% in the period.
As the chart below highlights, not only oil put also coal has emerged as a high-ticket import. Recent cool-off in global prices will be helpful in moderating demand, albeit idiosyncratic factors like demand for coal due to domestic supply shortages, for instance, are unlikely to moderate in a hurry, thereby boding unfavourably for overall trade balance. Concurrently, trends of non-gold non-oil imports have also proved to be sticky owing to robust domestic demand, reopening boost, and manufacturing push (higher demand for inputs). Part of these trends are also likely to limit the extent of correction in overall imports.
Trade imbalance with China widened to a record high in FY22, at $73bn from $44bn the year before. Much of this gap reflected the 45%yoy jump in imports whilst exports stagnated due to a slowdown in China’s domestic growth. Electronics, electrical machinery, chemicals, plastics, and fertilisers were the amongst the key segments that rose sharply on yoy terms and made 70% of the import basket.
This carries a few takeaways: a) move up to intermediate/ finished goods will initially be import intensive till domestic capabilities are expanded; b) while a slowing trading partner impacts India’s exports, the import demand remained resilient due to India’s post-reopening boost to growth
Global demand and INR
The recent softening in export performance comes at a time when fears of a slowdown in global growth is rising and there is significant pressure on the currency. Of these two factors, while a depreciating currency could contribute to better trade competitiveness, we argue that global demand dynamics will matter more for the direction of India’s exports.
A scatter plot chart of the changes in the rupee real effective exchange and exports show a wide dispersal, with weak to nil correlation. By contrast, exports signal a strong positive correlation with the demand-side driver i.e., global imports. Further we also ran a regression of changes in rupee nominal effective exchange rate basis (NEER) and India’s exports between 2008 and 2021, which reinforces our previous observation. A similar exercise for world’s imports (as a proxy for global demand) and India’s exports over two decades, shows the relationship is significant, with a one-unit change in global imports translating into a 1.4units change in exports.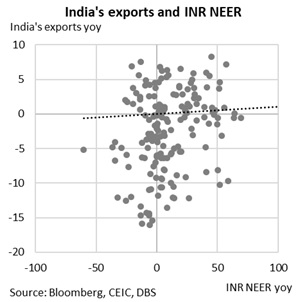
Admittedly, this argument misses on few nuances, particularly the role and impact of the domestic manufacturing push, supply chain support, logistical facilities, cost of production (final cost), physical and digital infrastructure, which also influence the extent of trade competitiveness.
Pressure, not panic, on external trade balances
Service trade has maintained a strong beat. Exports are up 30% yoy in the first five months of the fiscal year, even as imports rose sharply at 38%. The trade surplus widened to $50bn vs $42.3bn in the comparable period last year, surfacing as a key source of support (full year services surplus $120-130bn) for the external balances, even if overshadowed by a 2x wider goods trade gap. Computer services made up 67.8% of overall exports in FY22, with the US as the key destination (56% share), followed by Europe (31%) and Asia (6.5%).
For the year, current account math is in a soft spot. Factoring in the year-to-date run rate on the trade deficit, the full-year goods trade deficit is expected to add up to ~$300bn vs FY22’s $190bn. Service trade balance has maintained a strong trend and pulling overall invisibles and goods trade balance together, FY23 current account deficit is likely to top US$100bn, taking the balance to -3.7% of GDP from -1.2% year before. This combined with a volatile flows outlook but resilient FDI, will leave the balance of payments in red for the first time in three years. For next year, bringing together our expectation for slower exports and moderation in imports (on a correction in commodity prices), the current account deficit is likely to narrow to -2.7% of GDP
[1] Reuters
To read the full report, click here to Download the PDF.

Topic
Explore more
E & S FocusThe information herein is published by DBS Bank Ltd and/or DBS Bank (Hong Kong) Limited (each and/or collectively, the “Company”). This report is intended for “Accredited Investors” and “Institutional Investors” (defined under the Financial Advisers Act and Securities and Futures Act of Singapore, and their subsidiary legislation), as well as “Professional Investors” (defined under the Securities and Futures Ordinance of Hong Kong) only. It is based on information obtained from sources believed to be reliable, but the Company does not make any representation or warranty, express or implied, as to its accuracy, completeness, timeliness or correctness for any particular purpose. Opinions expressed are subject to change without notice. This research is prepared for general circulation. Any recommendation contained herein does not have regard to the specific investment objectives, financial situation and the particular needs of any specific addressee. The information herein is published for the information of addressees only and is not to be taken in substitution for the exercise of judgement by addressees, who should obtain separate legal or financial advice. The Company, or any of its related companies or any individuals connected with the group accepts no liability for any direct, special, indirect, consequential, incidental damages or any other loss or damages of any kind arising from any use of the information herein (including any error, omission or misstatement herein, negligent or otherwise) or further communication thereof, even if the Company or any other person has been advised of the possibility thereof. The information herein is not to be construed as an offer or a solicitation of an offer to buy or sell any securities, futures, options or other financial instruments or to provide any investment advice or services. The Company and its associates, their directors, officers and/or employees may have positions or other interests in, and may effect transactions in securities mentioned herein and may also perform or seek to perform broking, investment banking and other banking or financial services for these companies. The information herein is not directed to, or intended for distribution to or use by, any person or entity that is a citizen or resident of or located in any locality, state, country, or other jurisdiction (including but not limited to citizens or residents of the United States of America) where such distribution, publication, availability or use would be contrary to law or regulation. The information is not an offer to sell or the solicitation of an offer to buy any security in any jurisdiction (including but not limited to the United States of America) where such an offer or solicitation would be contrary to law or regulation.
This report is distributed in Singapore by DBS Bank Ltd (Company Regn. No. 196800306E) which is Exempt Financial Advisers as defined in the Financial Advisers Act and regulated by the Monetary Authority of Singapore. DBS Bank Ltd may distribute reports produced by its respective foreign entities, affiliates or other foreign research houses pursuant to an arrangement under Regulation 32C of the Financial Advisers Regulations. Singapore recipients should contact DBS Bank Ltd at 65-6878-8888 for matters arising from, or in connection with the report.
DBS Bank Ltd., 12 Marina Boulevard, Marina Bay Financial Centre Tower 3, Singapore 018982. Tel: 65-6878-8888. Company Registration No. 196800306E.
DBS Bank Ltd., Hong Kong Branch, a company incorporated in Singapore with limited liability. 18th Floor, The Center, 99 Queen’s Road Central, Central, Hong Kong SAR.
DBS Bank (Hong Kong) Limited, a company incorporated in Hong Kong with limited liability. 13th Floor One Island East, 18 Westlands Road, Quarry Bay, Hong Kong SAR
Virtual currencies are highly speculative digital "virtual commodities", and are not currencies. It is not a financial product approved by the Taiwan Financial Supervisory Commission, and the safeguards of the existing investor protection regime does not apply. The prices of virtual currencies may fluctuate greatly, and the investment risk is high. Before engaging in such transactions, the investor should carefully assess the risks, and seek its own independent advice.
Related Insights
- China chartbook: 2Q24 GDP growth tracking 5%25 Apr 2024
- Research Library25 Apr 2024
- Bank Indonesia’s proactive hike 24 Apr 2024
Related Insights
- China chartbook: 2Q24 GDP growth tracking 5%25 Apr 2024
- Research Library25 Apr 2024
- Bank Indonesia’s proactive hike 24 Apr 2024