| Mutual Funds | ||
| HDFC Mid-Cap Opportunities Fund Growth |
| OVERVIEW | FUND INFO | PORTFOLIO |

|
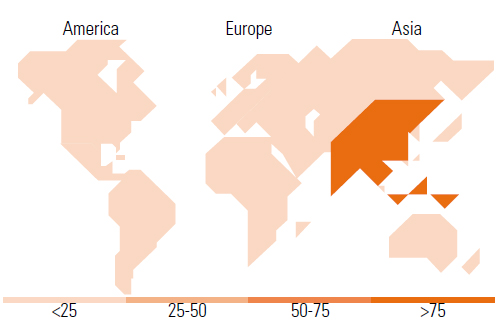
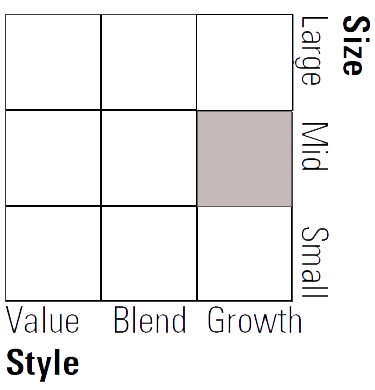
Morningstar® Category Mid-Cap |
Total Net Assets (mil) 225,994.21 INR |
|
Morningstar® Benchmark S&P BSE Midcap TR INR Used throughout report |
Fund Benchmark IISL NIFTY Midcap 100 TR INR |
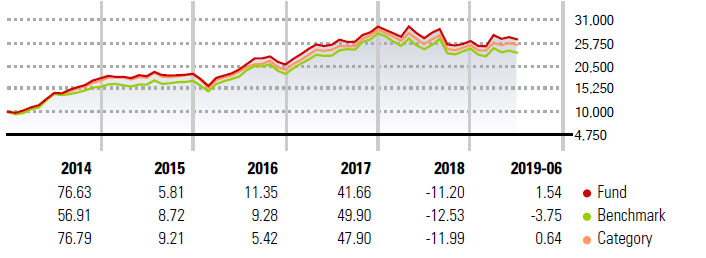
| RETURNS (%) | FUND | BENCHMARK | CATEGORY |
| 3M | -6.08 | -8.11 | -4.80 |
| 6M | -0.61 | -5.73 | -1.22 |
| 1Y | -5.76 | -5.69 | -3.52 |
| 3Y* | 8.24 | 6.41 | 7.28 |
| 5Y* | 12.41 | 10.02 | 10.55 |
| 10Y* | 19.23 | 12.14 | 15.72 |
| *Annualised Return | Data Through 18/07/2019 | ||
| QUARTERLY RETURNS (%) | Q1 | Q2 | Q3 | Q4 |
| 2019 | 5.22 | -3.50 | - | - |
| 2018 | -7.94 | -1.14 | -5.33 | 3.06 |
| 2017 | 17.10 | 3.90 | 2.68 | 13.39 |
| 2016 | -5.08 | 10.96 | 12.88 | -6.35 |
| 2015 | 1.81 | 0.79 | 0.99 | 2.10 |
| RISK MEASURES | |
| 3Y Alpha | 1.60 |
| 3Y Beta | 0.92 |
| 3Y R-Squared | 93.72 |
| 3Y Info Ratio | 0.30 |
| 3Y Tracking Error | 4.28 |
| 3Y Sharpe Ratio | 0.49 |
| 3Y Std Dev | 16.10 |
| 3Y Risk | abv avg |
| 5Y Risk | Avg |
| 10Y Risk | bel avg |
| Calculations use S&P BSE Midcap TR INR (where applicable) | |
Morningstar Style BoxTM
|
* Report as of 19 Jul 2019

© 2019 Morningstar. All Rights Reserved.
Disclaimer :
© 2019 Morningstar. All Rights Reserved. The information, data, analyses and opinions (“Information”) contained herein: (1) include the proprietary information of Morningstar and Morningstar’s third party licensors; (2) may
not be copied or redistributed except as specifically authorised;(3) do not constitute investment advice;(4) are provided solely for informational purposes; (5) are not warranted to be complete, accurate or timely; and (6) may
be drawn from fund data published on various dates. Morningstar is not responsible for any trading decisions, damages or other losses related to the Information or its use. Please verify all of the Information before using it
and don’t make any investment decision except upon the advice of a professional financial adviser. Past performance is no guarantee of future results. The value and income derived from investments may go down as well
as up.
 Cyclical
  Basic Materials
  Consumer Cyclical
  Financial Services
  Real Estate
  Sensitive
  Communication Services
 Energy
  Industrials
 Technology
 Defensive
  Consumer Defensive
 Healthcare
 Utilities