| Mutual Funds | ||
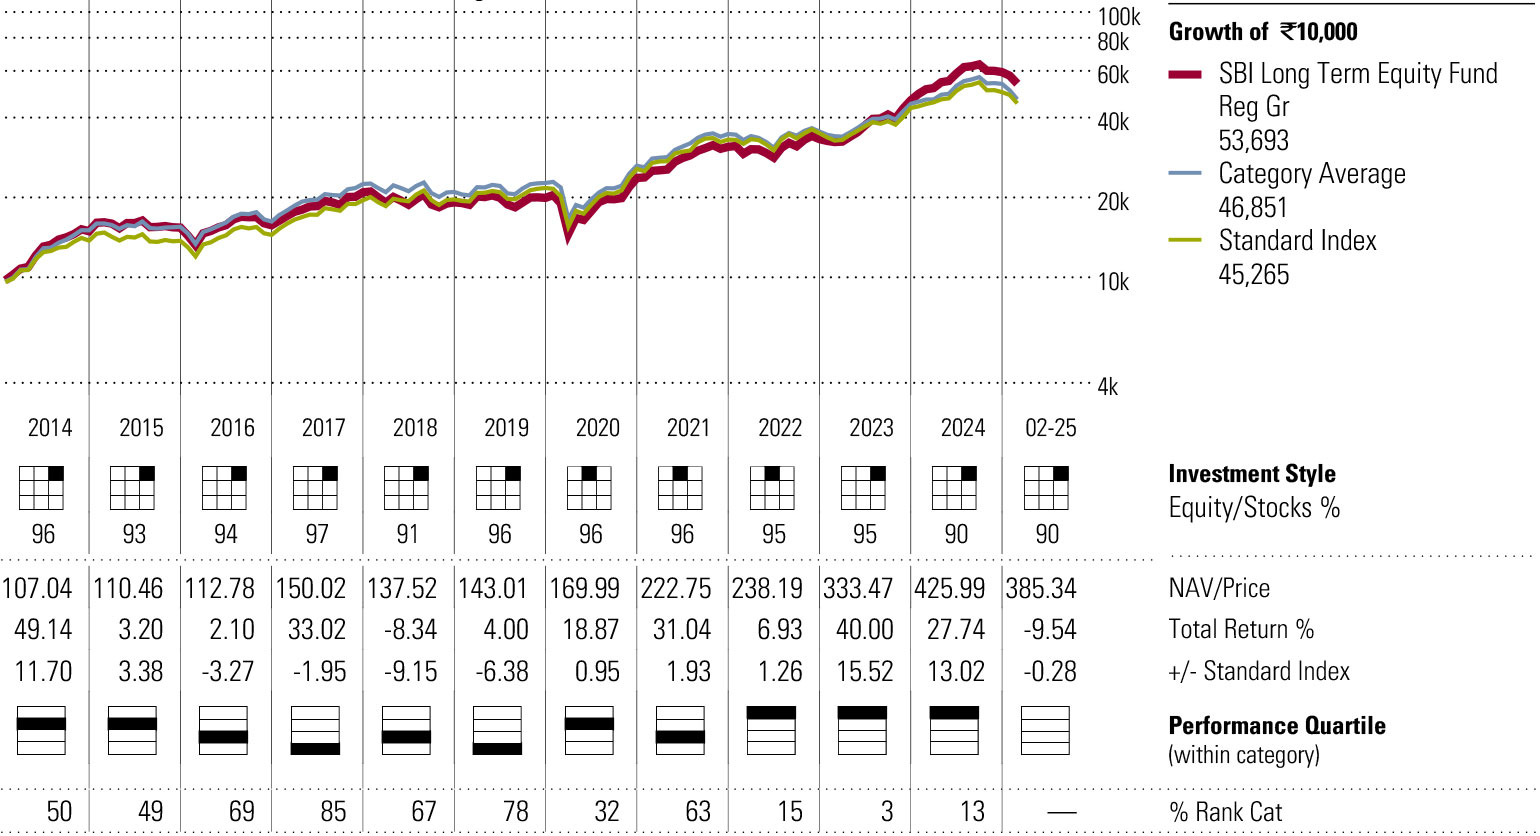
| SBI Long Term Equity Fund Reg Gr (INR) |
| OVERVIEW | FUND INFO | PORTFOLIO |

200 ELSS (Tax Savings)
Morningstar
Medalist RatingTM 12-27-2024 |
Analyst-Driven % 100.00 |
|
Data Coverage % 100.00 |
Standard Index BSE 200 India TR INR |
|
Category Index - |
Morningstar Cat ELSS (Tax Savings) |
Performance 05-31-2025
| Quarterly Returns | 1st Qtr | 2nd Qtr | 3rd Qtr | 4th Qtr | Total % |
| 2021 | 6.87 | 11.27 | 8.96 | 1.14 | 31.04 |
| 2022 | -2.09 | -7.01 | 10.37 | 6.41 | 6.93 |
| 2023 | -2.15 | 15.11 | 9.9 | 13.1 | 40 |
| 2024 | 11.23 | 13.49 | 8.19 | -6.47 | 27.74 |
| 2025 | -4.05 | — | — | — | 1.73 |
| Trailing Returns | 1 Yr | 3 Yr | 5 Yr | 10 Yr | Incept |
| +/- Std Index | 9.83 | 27.08 | 29.69 | 14.2 | 12.43 |
| Total Return | 0.95 | 9.52 | 5.43 | 0.46 | — |
Performance Disclosure
The Overall Morningstar Rating is based on risk-adjusted returns,
derived from a weighted average of the three-, five-, and 10-year
(if applicable) Morningstar metrics.
The performance data quoted represents past performance and
does not guarantee future results. The investment return and
principal value of an investment will fluctuate; thus an investor's
shares, when sold or redeemed, may be worth more or less than
their original cost.
Current performance may be lower or higher than return data
quoted herein. For performance data current to the most recent
month-end, please call +91 22 61793000 or visit www.sbimf.com.
www.sbimf.com.
| Risk and Return Profile |
|||
| 3 Yr | 5 Yr | 10 Yr | |
| 200 funds | 200 funds | 163 funds | |
| Morningstar RatingTM | 5★ | 5★ | 4★ |
| Morningstar Risk | +Avg | Avg | Avg |
| Morningstar Return | High | High | +Avg |
| | |||
| 3 Yr | 5 Yr | 10 Yr | |
| Standard Deviation | 14.16 | 13.91 | 16.66 |
| Mean | 27.08 | 29.69 | 14.20 |
| Sharpe Ratio | 1.32 | 1.57 | 0.54 |
| | ||
| MPT Statistics | Standard Index | Best Fit Index |
| Alpha | 8.46 | — |
| Beta | 0.95 | — |
| R-Squared | 91.08 | — |
 |
 |
* Release date 05-31-2025

© 2025 Morningstar. All Rights Reserved.
Disclaimer :
© 2025 Morningstar. All Rights Reserved. Unless otherwise provided in a separate agreement, you may use this report only in the country in which its original distributor is based. The information, data, analyses and
opinions contained herein (1) include the confidential and proprietary information of Morningstar, (2) may include, or be derived from, account information provided by your financial professional which cannot be verified by
Morningstar, (3) may not be copied or redistributed, (4) do not constitute investment advice offered by Morningstar, (5) are provided solely for informational purposes and therefore are not an offer to buy or sell a security,
and (6) are not warranted to be correct, complete or accurate. Except as otherwise required by law, Morningstar shall not be responsible for any trading decisions, damages or other losses resulting from, or related to, this
information, data, analyses or opinions or their use. Opinions expressed are as of the date written and are subject to change without notice. Investment research is produced and issued by subsidiaries of Morningstar, Inc.
including, but not limited to, Morningstar Research Services LLC, registered with and governed by the U.S. Securities and Exchange Commission. This report is supplemental sales literature. If applicable it must be preceded
or accompanied by a prospectus, or equivalent, and disclosure statement. Please see important disclosures at the end of this report. The ESG-related information, methodologies, tool, ratings, data and opinions contained or
reflected herein are not directed to or intended for use or distribution to India-based clients or users and their distribution to Indian resident individuals or entities is not permitted, and Morningstar/Sustainalytics accepts no
responsibility or liability whatsoever for the actions of third parties in this respect.
 Cyclical
  Basic Materials
  Consumer Cyclical
  Financial Services
  Real Estate
  Sensitive
  Communication Services
  Energy
  Industrials
  Technology
  Defensive
  Consumer Defensive
  Healthcare
  Utilities