Strong operating performance despite significant
rate headwinds
We achieved another year of strong operating performance despite
the most challenging rate environment in recent years. Total income rose 3% to a record
SGD 22.9 billion as proactive hedging, robust deposit and investment AUM inflows, and our
ability to capture market opportunities across businesses more than offset the
rate pressures. The cost-income ratio was unchanged at 40%, and profit before allowances
increased 2% to a record SGD 13.7 billion. Profit before tax of
SGD 13.1 billion was also a new high. Net profit was 3% lower at SGD 11.0 billion,
reflecting higher taxes from the 15% global minimum tax. Return on equity of 16.2% was
within our 15–17% medium-term target and remained several percentage points above local and
most global peers.
The results underscored the breadth and resilience of our
franchise as we navigated an operating environment shaped by geopolitical rifts and trade
tensions.
The year began on a relatively benign footing, supported by Fed
rate cuts in late 2024 and constructive market sentiment from solid corporate earnings and
steady global growth, but this quickly gave way to a new phase of uncertainty following US
tariff announcements. Resultant movements in interest rates and FX had a material impact on
our performance.
In Singapore and Hong Kong, interest rates declined sharply, even
as the Fed paused rate cuts between December 2024 and September 2025. Sora fell about 160
basis points amid an unusually strong liquidity backdrop, driven by robust foreign inflows
and domestic liquidity accumulation. Hibor also fell by around 160 basis points due
to flush system liquidity conditions. At the
same time, the Singapore dollar appreciated around 2% against the USD, HKD and RMB, and
about 6% against INR and IDR, resulting in FX translation losses on our non-SGD earnings.
Taken together, these interest rate and FX movements created a net interest income headwind
of well over SGD 1 billion for the year.
Net interest income resilience from hedging and
deposit growth
Despite the sizeable headwind, group net interest income was
slightly higher than the previous year at a record SGD 14.5 billion. This reflected two key
factors.
The first was proactive balance sheet hedging. Over the past
three to four years, while interest rates were higher, we acted early to pre-empt the impact
of falling rates by locking in asset yields for longer tenors. Our fixed-rate assets –
comprising fixed-rate mortgages, interest rate swaps and fixed income securities – were
increased by about SGD 70 billion to SGD 210 billion, or one-third of the commercial book.
This positioning reduced our net interest income sensitivity to rate movements
significantly. As at end-2025, net interest income sensitivity stood at
SGD 10 million per basis-point change in
interest rates for the SGD book and negative SGD 4 million per basis-point change for
the USD book. For the full year, group net interest margin declined 12 basis points to
2.01%, a smaller compression than local peers, reflecting the benefit of these hedges.
The second factor was robust deposit inflows. Singapore continued
to attract substantial liquidity as a regional wealth hub and financial safe haven, and this
was bolstered by the strong performance of the Singapore dollar against the USD and other
major currencies. With interest rates falling, there was also a shift of retail funds from
treasury bills back into deposits. Deposits grew
SGD 64 billion or 12% in constant-currency terms to SGD 610 billion, the largest absolute
increase in the bank’s history, with over
two-thirds in Casa. The increase in deposits funded loan growth and higher deployment into
liquid assets, both supporting net interest income.
Loans grew SGD 24 billion or 6% in constant-currency terms to SGD
445 billion, driven
by broad-based growth in corporate and non-housing consumer loans. Non-trade corporate loan
pipelines remained healthy despite the uncertain environment, although high repayments in
North Asia tempered growth. Trade loan growth was underpinned by expansion in targeted
client segments, while non-housing consumer loans were led by wealth management lending.
Deposit growth outpaced loan growth, and we nimbly deployed the
excess liquidity into low-risk non-loan assets, including an increase of SGD 42 billion in
HQLA to
SGD 208 billion. While this deployment lowered net interest margins, it was accretive to
earnings and return on equity.
Record non-interest income reflects nimble
execution
and structural strengths
Non-interest income was the main growth engine during the year.
Net fee income rose 18% to a record SGD 4.90 billion, while treasury customer sales
increased 14% to
a new high of SGD 2.14 billion. These gains reflected both cyclical and structural drivers.
Wealth management was the largest contributor to fee growth, with
fees rising 29% to SGD 2.81 billion. After a brief post-Liberation Day soft patch, investor
sentiment recovered as tariff concerns eased and macro and earnings data remained resilient.
Structurally, we benefitted from healthy AUM inflows into Singapore and Hong Kong as global
wealth hubs and from the investments made over the years to deepen our franchise. The Citi
Taiwan integration broadened opportunities in Taiwan, while our refreshed digital wealth
strategy gained traction and supported stronger contributions from retail wealth.
Fee contributions from Institutional Banking also strengthened.
Transaction services fees grew 3% to a record SGD 942 million, supported by higher cash
management fees
from increased payment activity and greater client wallet share, and growth in custody fees
across both traditional securities and digital assets.
Loan-related fees increased 14% to
SGD 733 million, also a new high, reflecting the structural strengthening of our expertise
in target industries and client engagement, even as industry volumes were broadly unchanged.
Investment banking fees rose 45% to
SGD 146 million, as improved capital market conditions supported ECM and DCM deal activity.
Increased capital flows within Asia and between Asia and the GCC created additional
opportunities, and our origination and distribution capabilities positioned us well to
capture these flows.
Treasury customer sales were another key driver of non-interest
income growth, reaching a record level as wealth
management and institutional client demand for investment and hedging solutions rose amid
heightened volatility.
Markets trading non-interest income was 11% lower from a year
ago, though overall markets trading income – combining net interest income and non-interest
income – rose 49% to SGD 1.37 billion, the highest
since 2021. Results were buoyed by periods of higher market volatility following
tariff-related developments, and by stronger treasury customer flows that supported higher
warehousing gains.
Cost discipline and sustained digital leadership
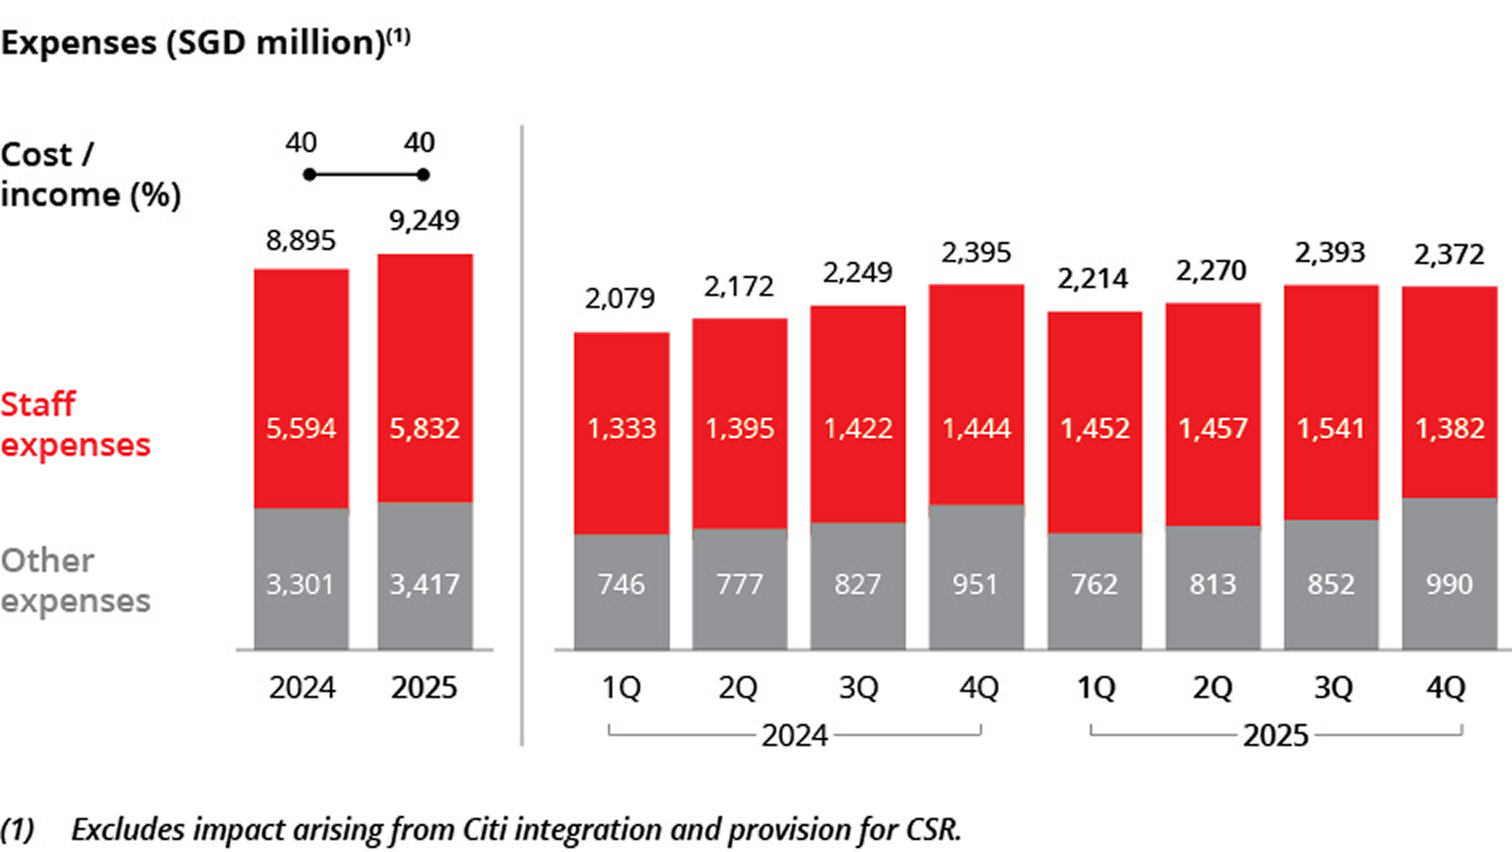
Expenses rose 4% to SGD 9.25 billion led by higher staff costs.
Headcount declined due to reductions in certain overseas markets following the completion of
integration work, while automation and Gen AI adoption supported productivity and contained
resourcing needs. Non-staff expenses were higher mainly from revenue-related items such as
marketing and sales incentives. The cost-income ratio was unchanged at 40%.
DBS has been a first mover in digital transformation, investing
early in digitalisation, data and AI well before the current Gen AI wave, while transforming
the way we work and fostering a strong
innovation culture. These efforts, showcased at our 2017 and 2023 digital investor days,
have delivered tangible improvements in ROE. We will continue to reinvest efficiency gains
into new builds and enhancements to sustain this momentum. Economic impact from data
analytics and AI/ ML was approximately SGD 1 billion in 2025.
Balance sheet remains healthy
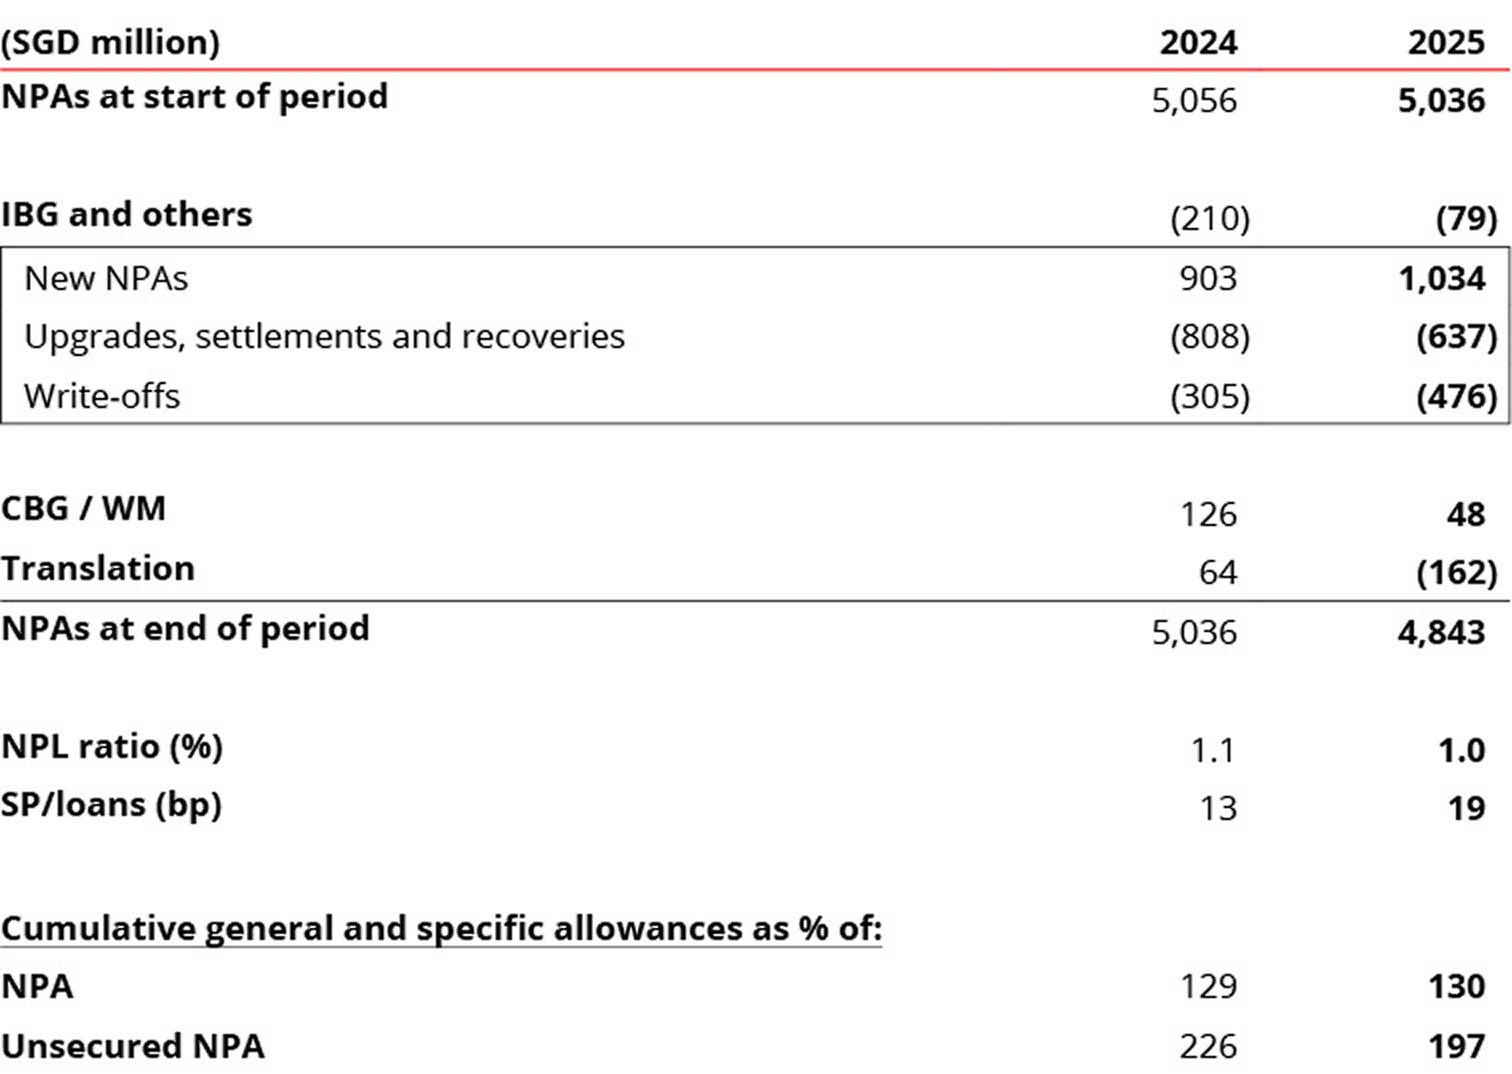
Asset quality was resilient. Non performing assets fell 4%, as
new NPA formation – which included a previously watchlisted real estate exposure prudently
downgraded
to NPL in the fourth quarter – was more than offset by upgrades, repayments and write-offs.
The NPL ratio was stable at 1.0%. Specific allowances amounted to SGD 854 million or 19
basis points of loans, around the historical cycle average.
General allowances of SGD 63 million were written back. There was
an increase in management overlays of around SGD 200 million in the first quarter as a
prudent measure following Liberation Day. This was offset by write-backs over the remainder
of the year, including amounts previously set aside for the real estate exposure downgraded
in the fourth quarter.
Total allowance reserves stood at SGD
6.28 billion, comprising general allowance reserves of SGD 3.86 billion and specific
allowance reserves of SGD 2.42 billion. Allowance coverage was 130%, and 197% after
considering collateral.
Capital remained healthy. The reported Common Equity Tier-1 ratio
was 17.0% based on transitional arrangements. The pro-forma ratio on a fully phased-in basis
was 15.0%. The leverage ratio was at 6.2%, more than twice the regulatory minimum of 3%.
Delivering on our multi-year capital return
commitments
In 2025, we began executing the SGD 8 billion excess capital
return framework announced last year, while continuing to deliver the ordinary dividend
increases guided at our 2023 Investor Day.
The excess capital framework comprises an SGD 3 billion share
buyback programme and SGD 5 billion to be returned through Capital Return dividends of SGD
0.15 per quarter over three years. During the year,
we commenced these initiatives, completing about 12% of the buyback programme, stepping up
repurchases when the share price dipped following Liberation Day.
We also started paying the Capital Return dividend from the first quarter. These initiatives
are intended to reduce our stock of excess capital and are in addition to
our customary progression of ordinary dividends.
For financial year 2025, the Board proposed a final ordinary
dividend of SGD 0.66 per share, an increase of SGD 0.06 from the prior year’s final payout,
and a Capital Return dividend of SGD 0.15 per share, bringing
the total dividend for the year to SGD 3.06 per share, up 38% from the previous year. Taking
the proposed final ordinary dividend of SGD 0.66 per share together with the Capital Return
dividend of SGD 0.15 per share, the annualised total dividend amounts to SGD 3.24 per share.
These distributions are underpinned by our healthy capital position and strong earnings
generation.
Total shareholder returns
Total shareholder returns for the calendar year were 35%,
comprising share price gains of 29% and dividends of SGD 2.85 per share. Dividends paid
included the ordinary dividend for the fourth quarter of 2024 as
well as ordinary and Capital Return dividends for the first three quarters of 2025.
Outlook
2026 is likely to remain a volatile year. Geopolitical fractures,
tariff shocks and fiscal and monetary policy shifts are prompting customers to prioritise
resilience and diversify risks and dependencies, and to partner banks that are stable,
trusted and future-ready to support them through change. DBS is well positioned in this
environment.
We expect total income in 2026 to be around 2025 levels. Fee
income and treasury customer income combined is expected to grow at a high-single-digit rate
as we capture client diversification flows. This should offset a slightly lower group net
interest income, reflecting the full-year impact of lower Sora and a stronger Singapore
dollar, mitigated in part by balance sheet hedges and continued deposit growth.
We expect the cost-income ratio to be in the low-40% range as we
maintain cost discipline.
Specific allowances are assumed to be within 17–20 basis points
of loans. Asset quality remains sound, with general allowance buffers providing resilience
amid ongoing geopolitical and policy uncertainty, and potential for write-backs should
conditions stabilise.
Overall, net profit in 2026 is expected to be slightly below 2025
levels.
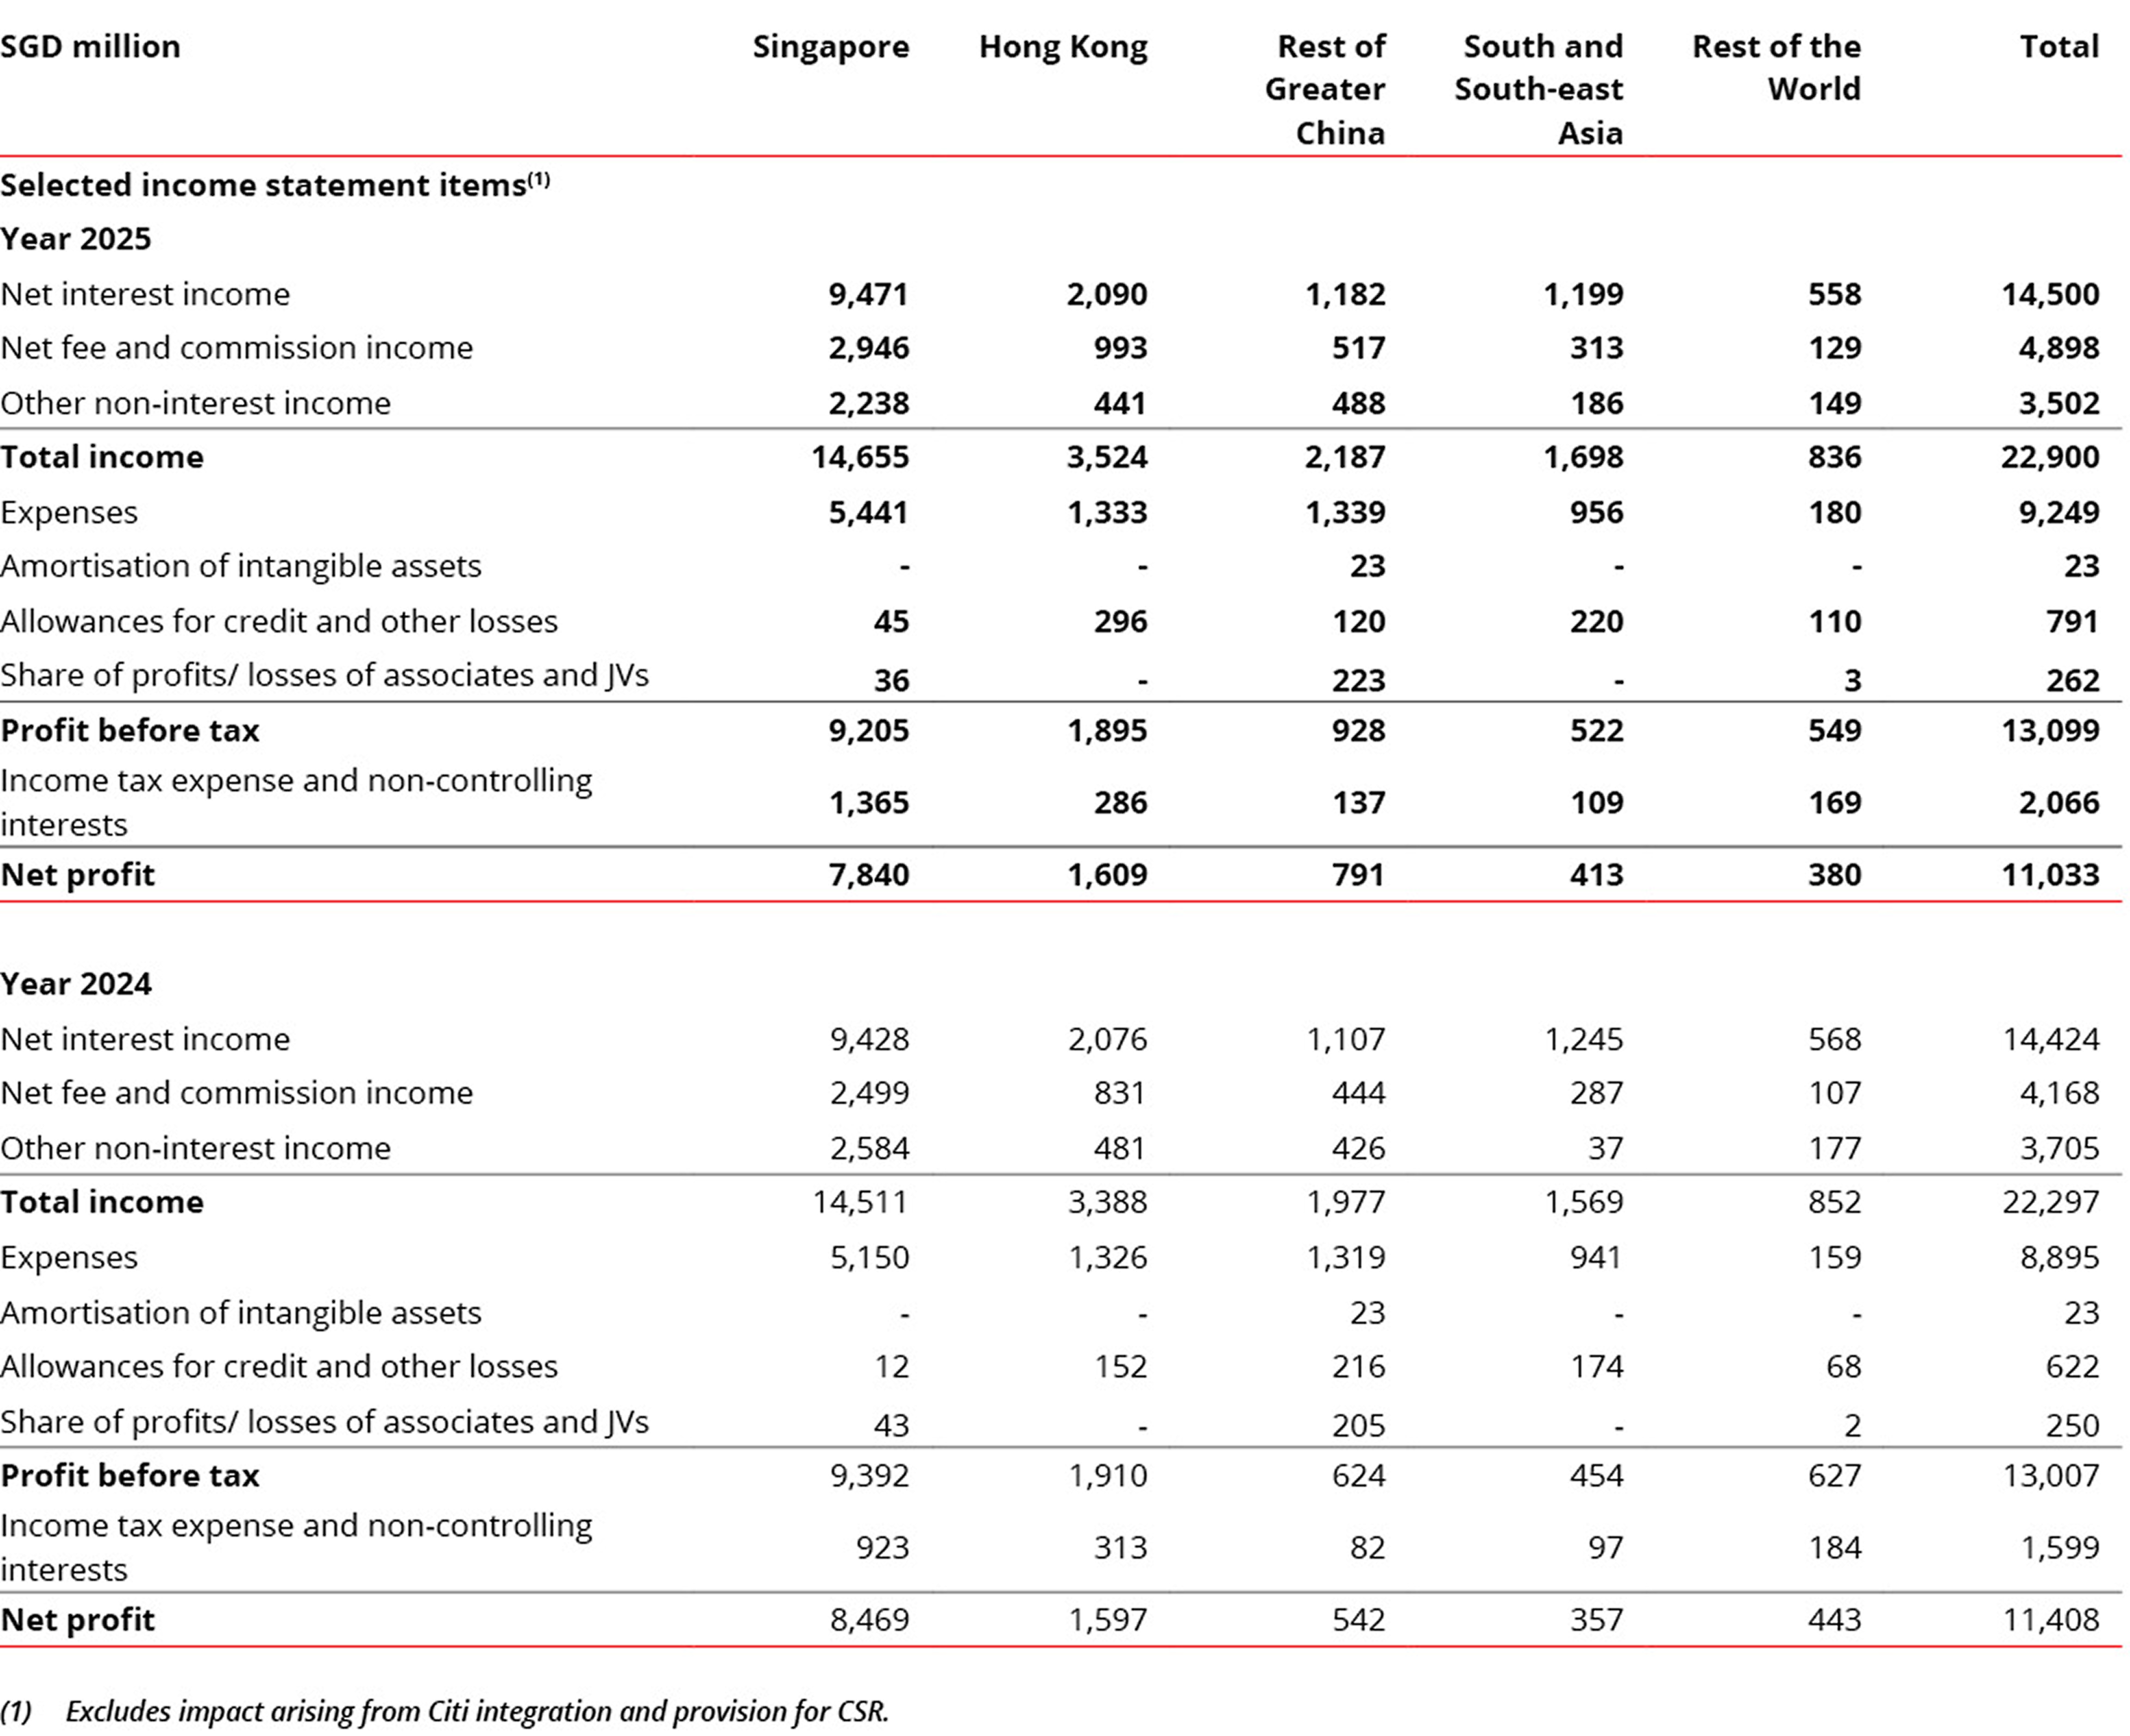
(A) Geographic segment performance
Singapore and Hong Kong, our two largest markets, delivered total
income growth of 1% to SGD 14.7 billion and 4% to SGD 3.52 billion respectively despite
significant rate headwinds. In both markets, net interest income was supported by strong
deposit growth and balance sheet hedging, while non-interest income increased led by wealth
management. Singapore net profit declined 7% to SGD 7.84 billion, due to the impact of the
15% global minimum tax, while Hong Kong net profit rose 1% to SGD 1.61 billion.
Our key growth markets of India, Indonesia, Taiwan and China all
posted double-digit net profit growth, underpinned by robust non-interest income momentum.
South and Southeast Asia total income increased 8% to SGD 1.70
billion. In India, Institutional Banking sustained strong momentum, with growth across
loans, current account balances and treasury customer sales, particularly from large
corporates in GIFT City, while markets trading benefitted from improved market conditions.
Consumer Banking repivoted following regulatory changes, exiting certain ecosystem
partnerships in cards and unsecured lending, while refocusing on segments such as gold
loans, where traction improved in the second half. Indonesia performed well despite a softer
operating environment, as higher non-interest income from FX, derivatives, investment
products and loan fees more than offset net interest margin compression. For the region,
expenses grew 2% to SGD 956 million, while total allowances increased 26% to SGD 220
million. Net profit rose 16% to a record SGD 413 million.
Rest of Greater China total income rose 11% to SGD 2.19 billion.
In Taiwan, the scaled-up franchise following the Citi Taiwan integration and improved sales
productivity supported stronger bancassurance and investment product flows, as well as
higher card fees. Markets trading performance was also robust. In Mainland China, total
income growth was led by non-interest income across wealth management, transaction services,
capital markets and markets trading activities. We continued to deepen our presence in the
Greater Bay Area, including increasing our stake in Shenzhen Rural Commercial Bank to 19.9%.
For the region, expenses grew 2% to SGD 1.34 billion, while total allowances declined 44% to
SGD 120 million. Net profit rose 46% to SGD 791 million.
Geographic segment performance
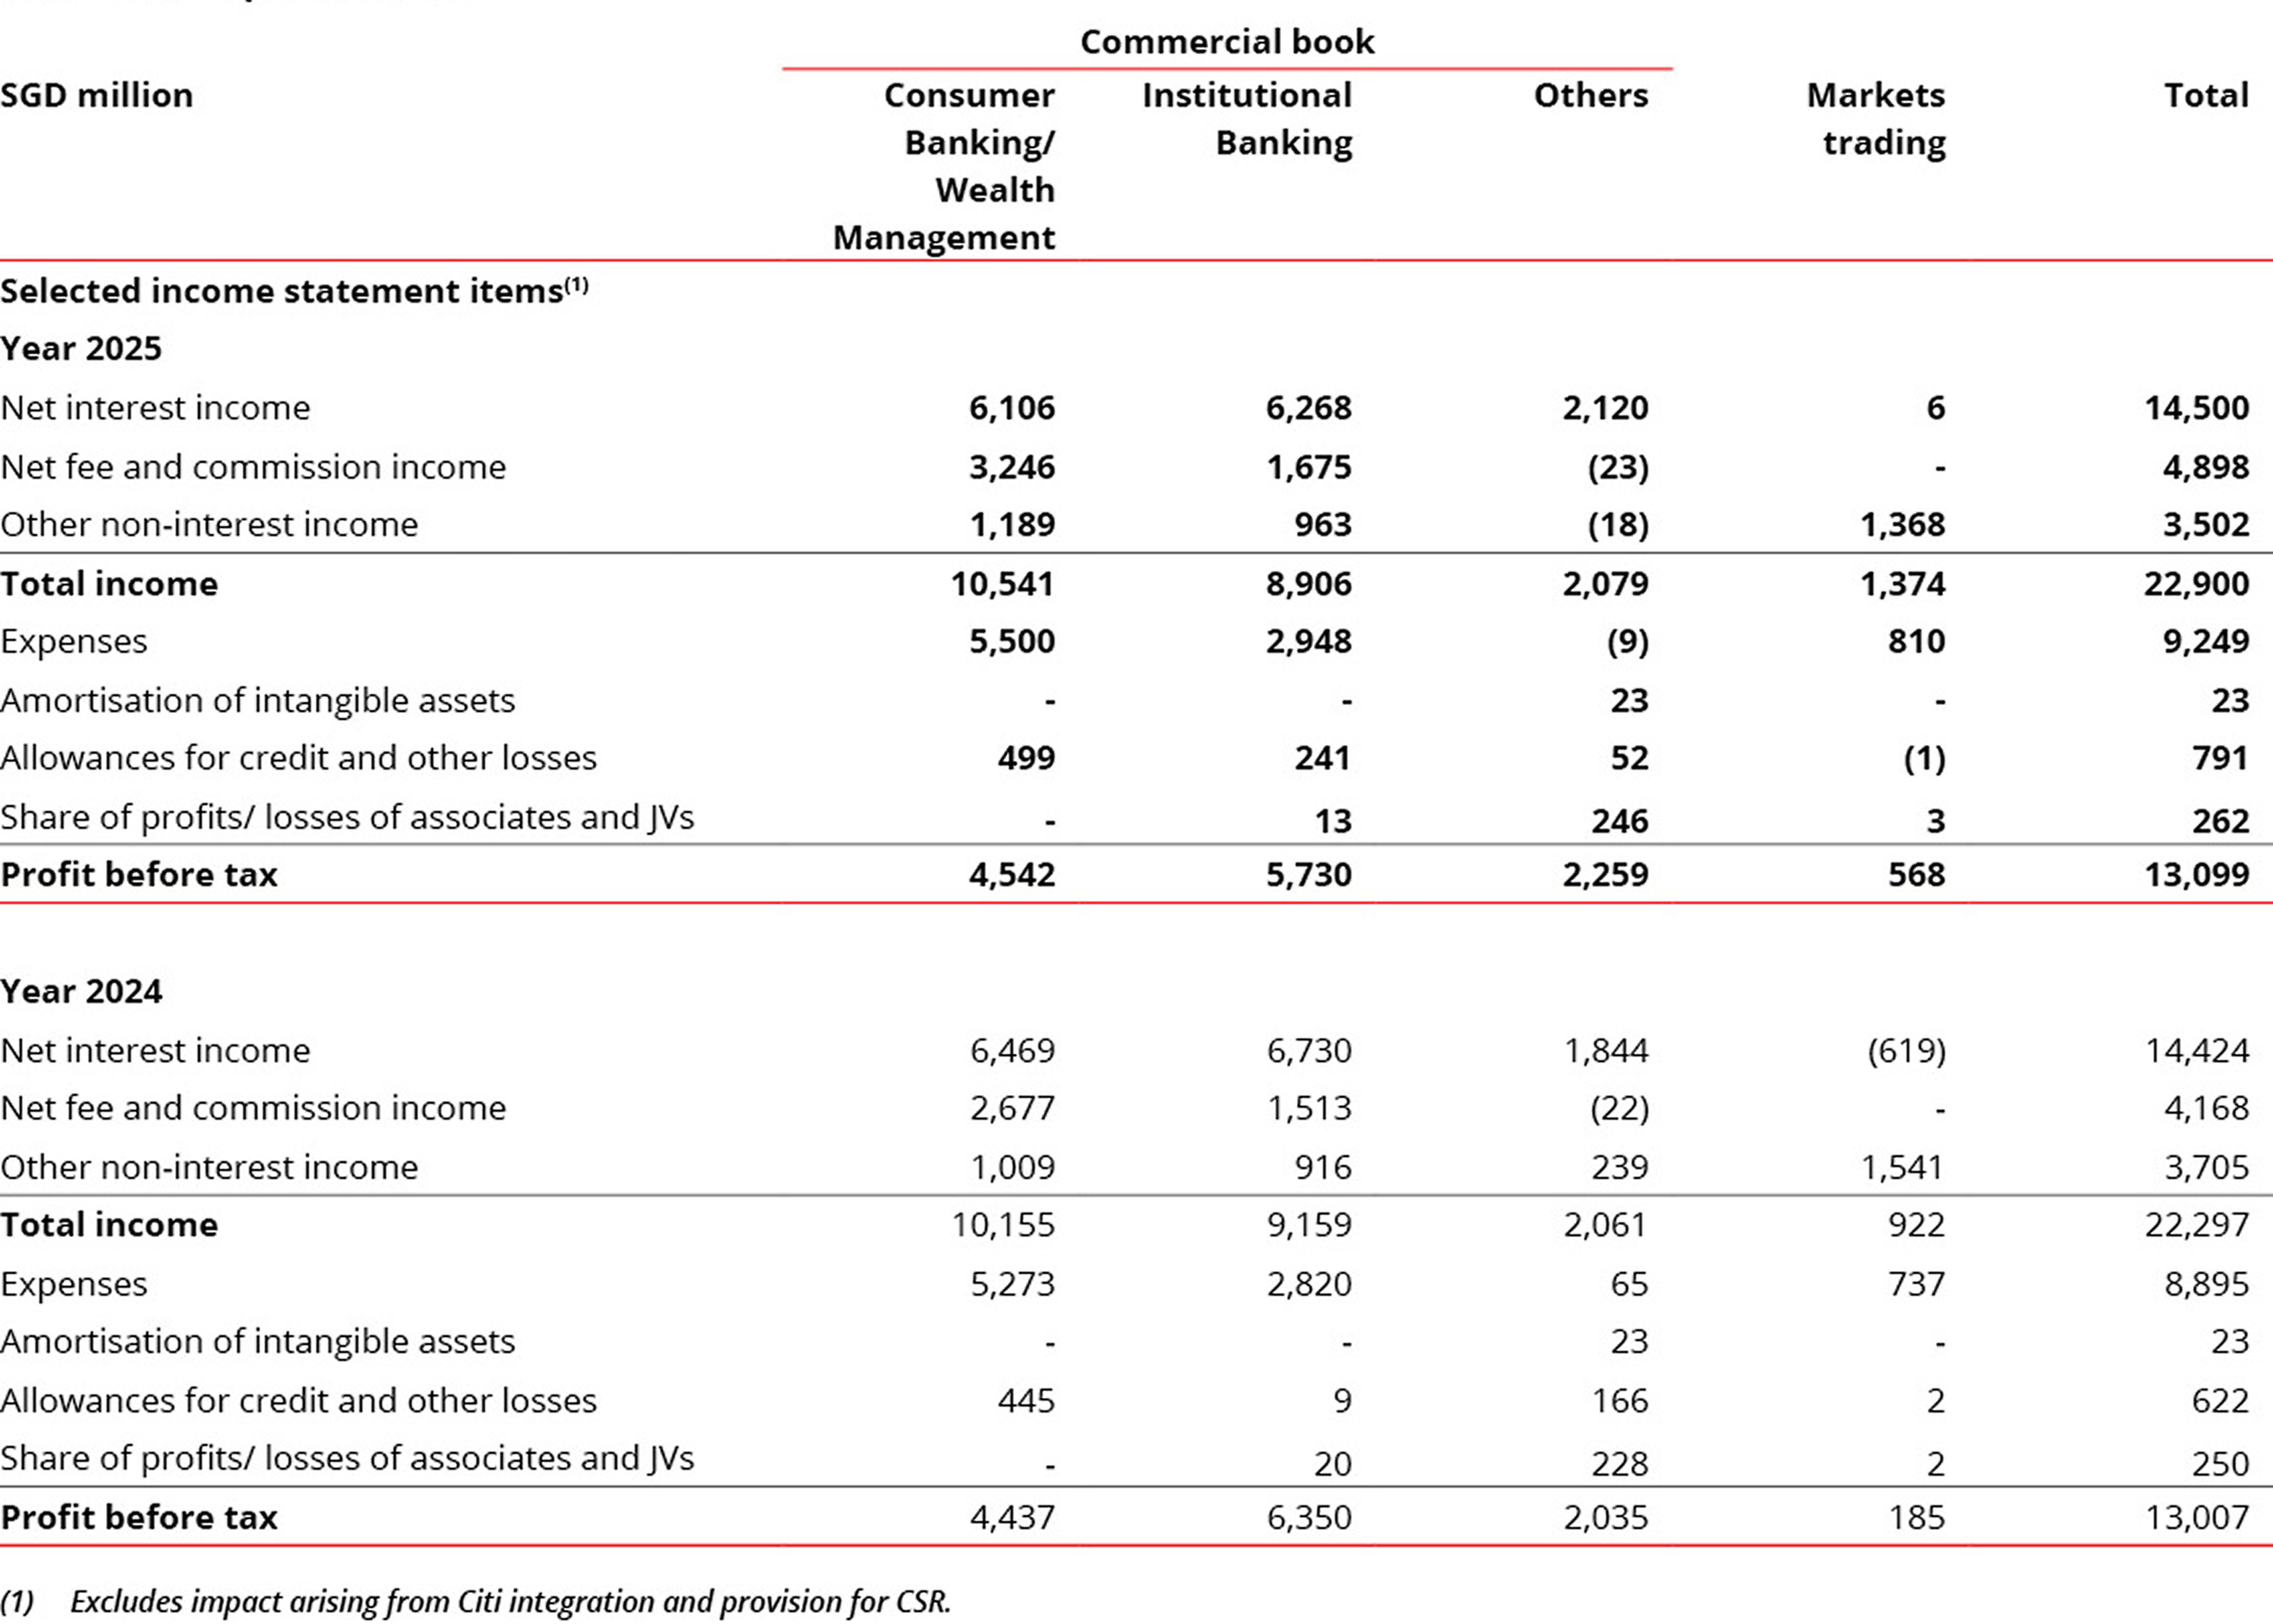
(B) Business unit performance
Consumer Banking/ Wealth Management total income grew 4% to SGD
10.5 billion. Net interest income declined 6% to SGD 6.11 billion as lower net interest
margin was mitigated by volume growth. Non-interest income grew 20% to SGD 4.44 billion led
by double-digit percentage growth in investment and bancassurance fees. Record net new money
inflows of SGD 39 billion drove AUM up 19% in constant-currency terms to
SGD 488 billion. Expenses increased 4% to SGD 5.50 billion, while total allowances rose 12%
to SGD 499 million. Profit before tax grew 2% to SGD 4.54 billion.
Institutional Banking total income declined 3% to SGD 8.91
billion as record loan-related fees, cash management fees and treasury customer income were
offset by lower net interest income. Expenses increased 5% to SGD 2.95 billion. Total
allowances rose by SGD 232 million to
SGD 241 million due to higher specific allowances largely from the real estate NPL in the
fourth quarter. Profit before tax fell 10% to SGD 5.73 billion.
Markets trading income rose 49% to SGD 1.37 billion, the highest
since 2021, with interest rates, equity derivatives and FX activities benefiting from lower
funding costs and a more conducive trading environment. Expenses increased 10% to SGD 810
million. Profit before tax tripled to SGD 568 million.
The Others segment encompasses the results of corporate decisions
that are not attributed to business segments. It includes earnings on capital deployed into
high-quality assets, earnings from non-core asset sales and certain other head office items
such as centrally raised allowances.
Business unit performance
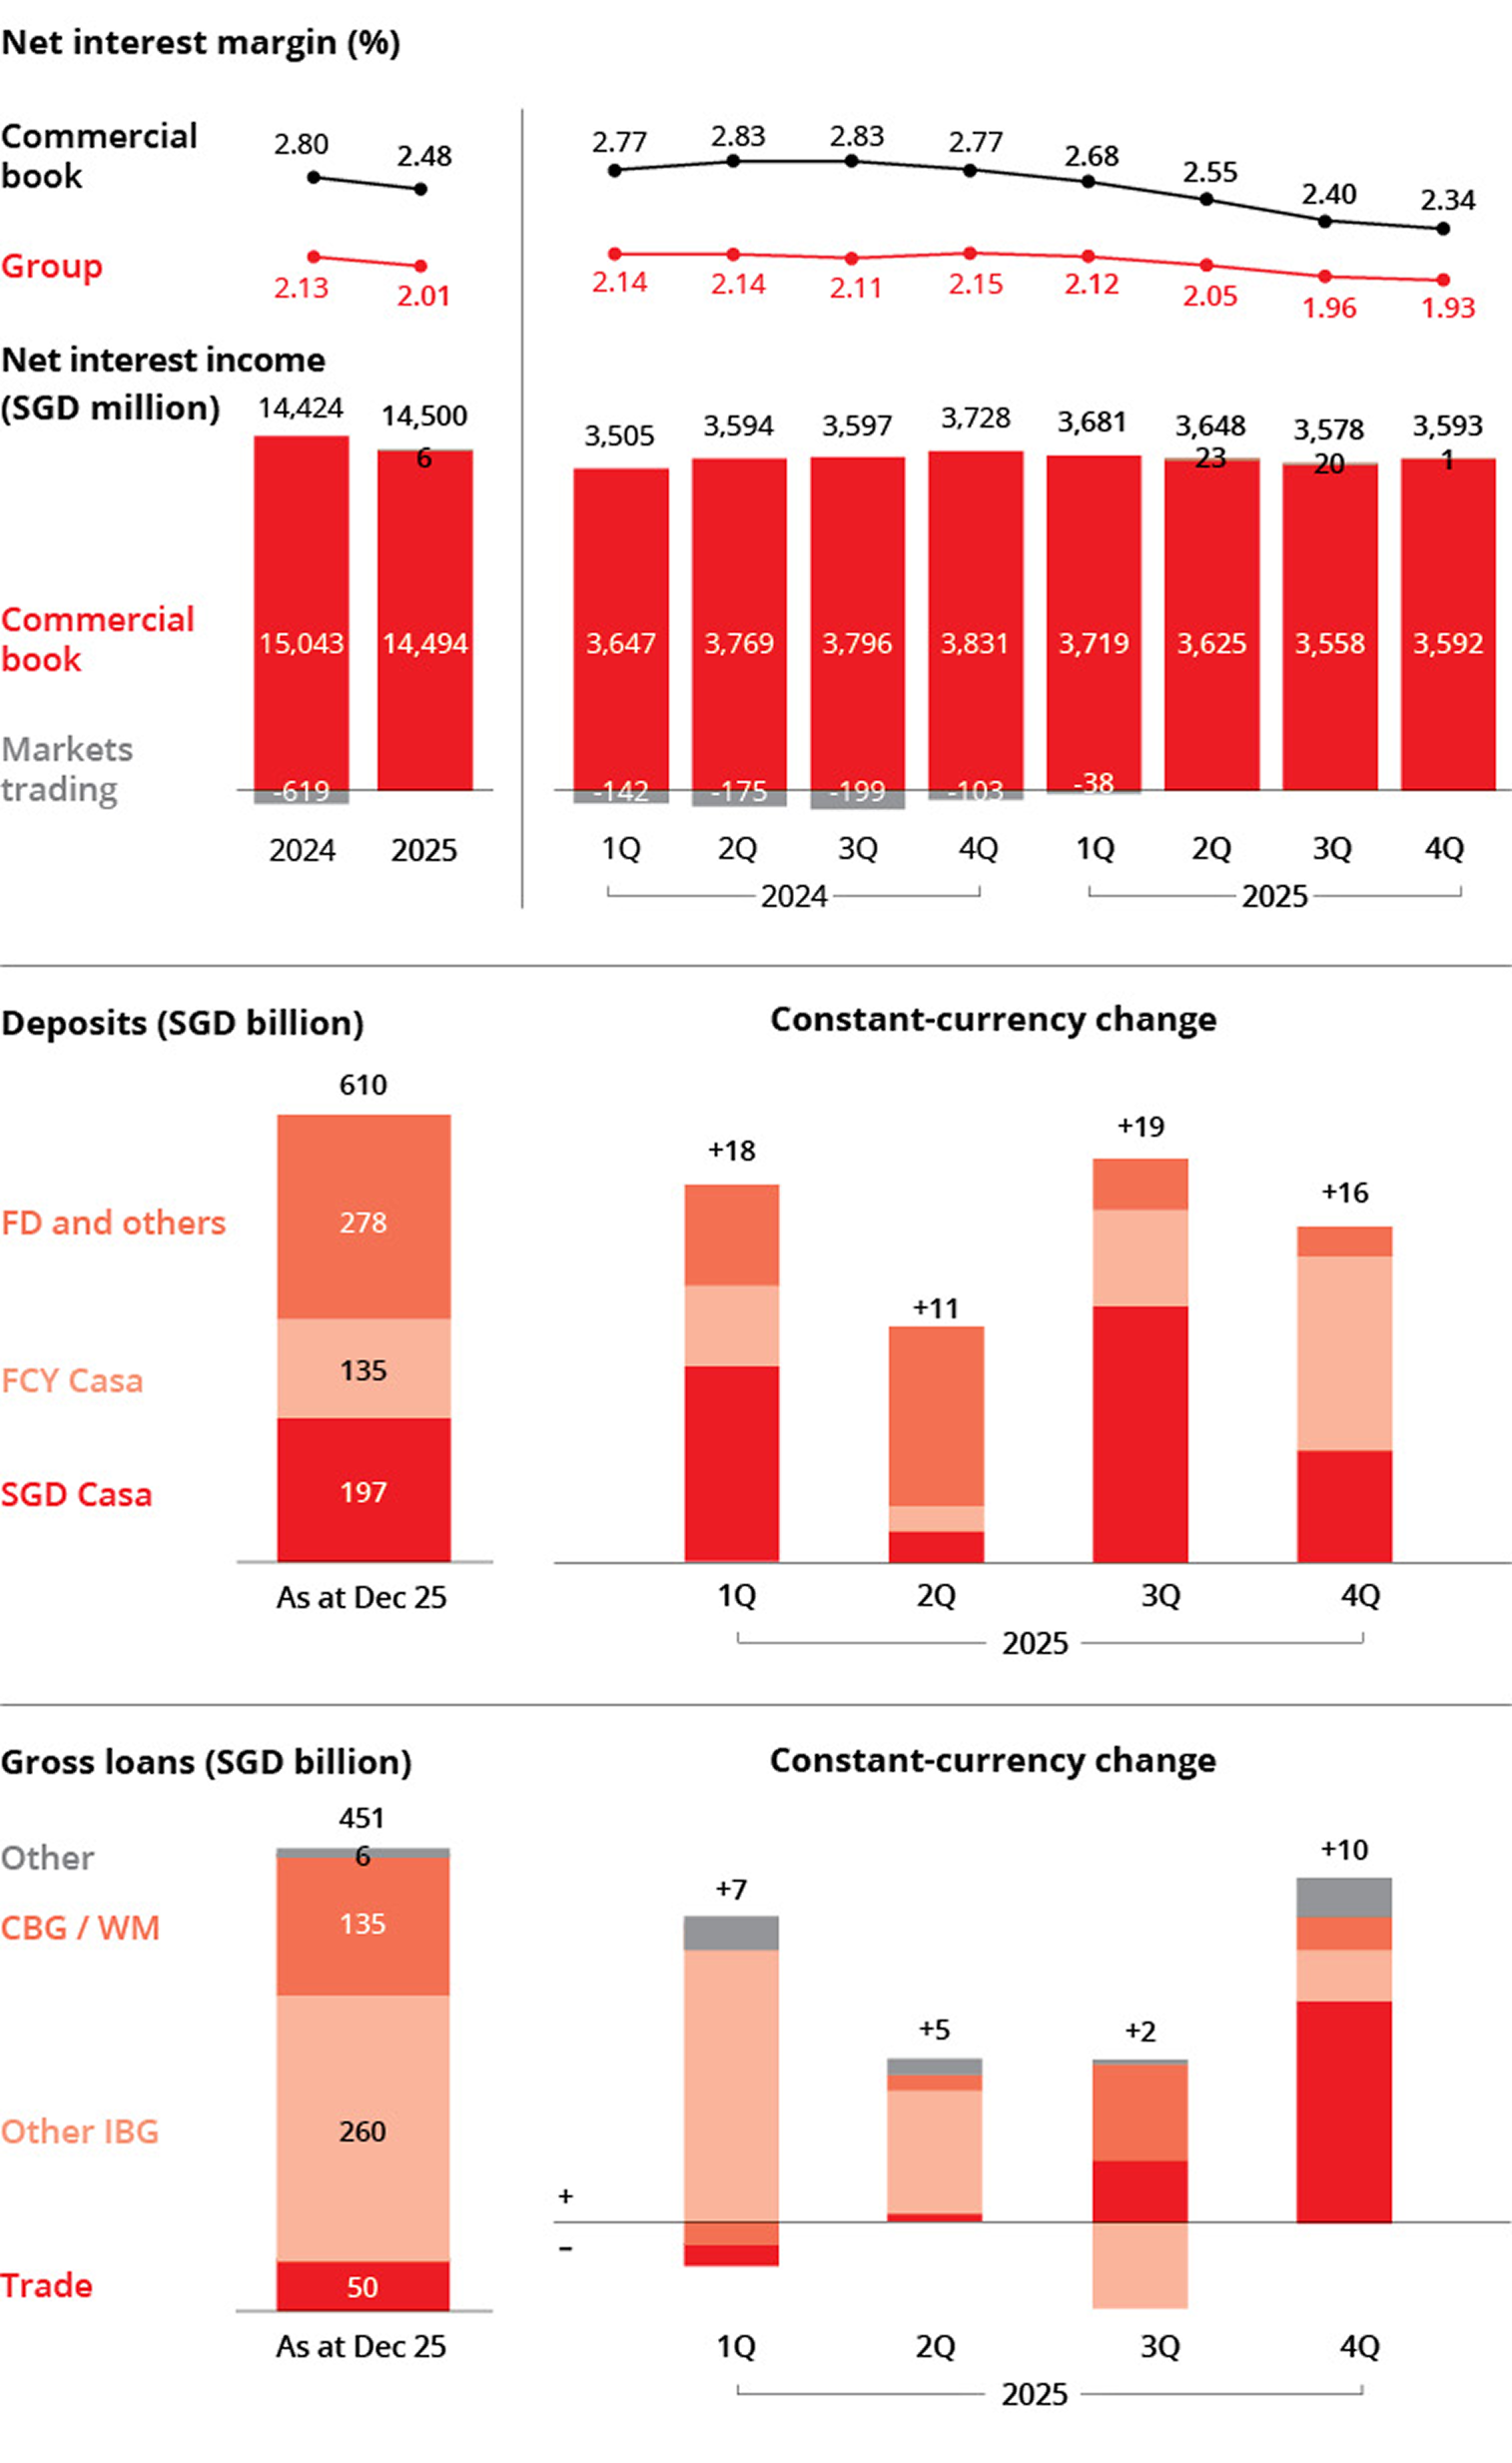
(C) Net interest income
Group net interest income was modestly higher at SGD 14.5
billion, as balance sheet hedging and record deposit growth offset sharp declines in Sora
and Hibor and adverse FX translation from a stronger Singapore dollar. Commercial book net
interest income declined 4% from a lower net interest margin.
Deposits grew SGD 64 billion or 12% in constant-currency terms to
SGD 610 billion, the largest absolute increase in the bank’s history, with over two-thirds
of the increase in Casa. SGD Casa rose as funds from maturing T-bills flowed back into
deposits, while foreign currency Casa growth was broad-based across wealth and corporate
clients.
Gross loans grew SGD 24 billion or 6% in constant-currency terms
to SGD 451 billion, led by broad-based growth in corporate and wealth management loans. As
deposits continued to grow faster than loans, surplus deposits were deployed into liquid
assets, which was accretive to net interest income and ROE.
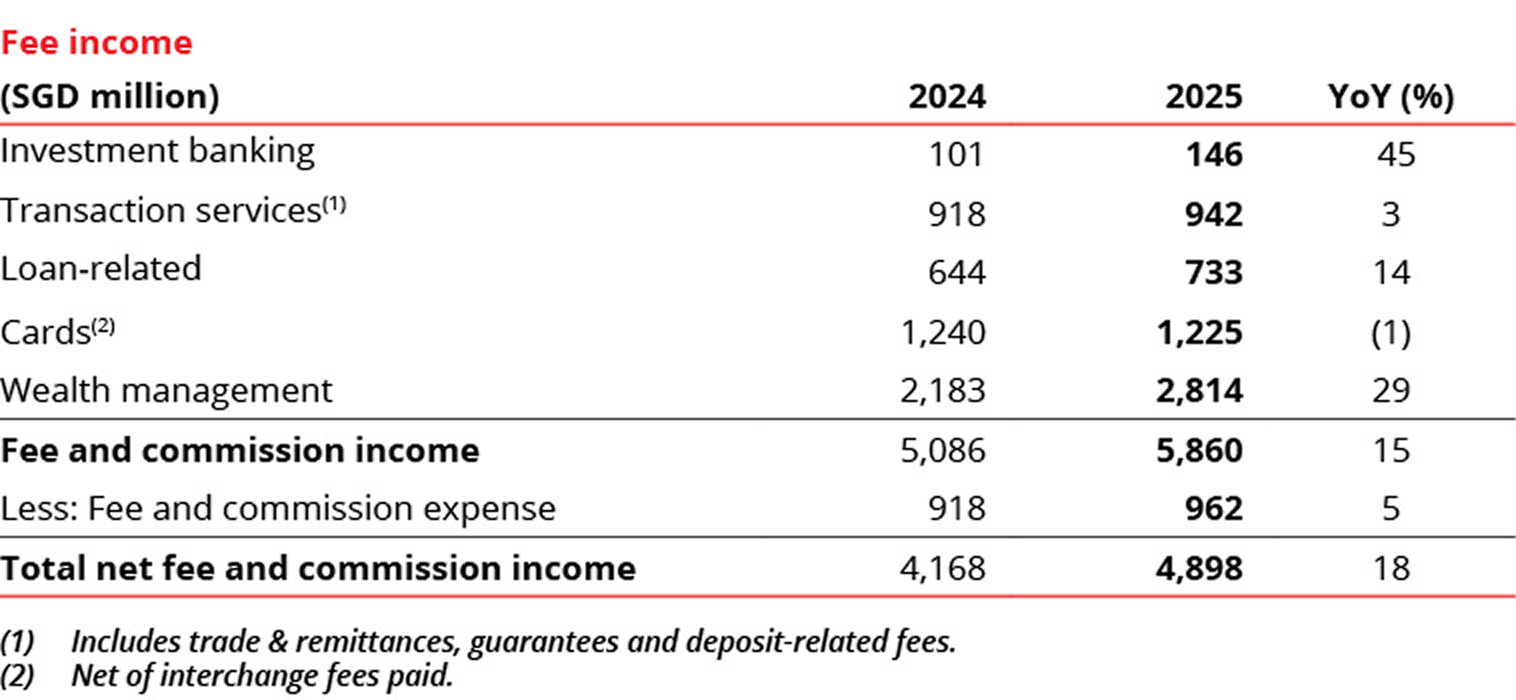
(D) Non-interest income
Net fee income rose 18% to SGD 4.90 billion. Wealth management
fees increased 29% to a record SGD 2.81 billion. Transaction service and loan-related fees
also reached new highs, while investment banking fees were higher. Card fees were slightly
lower.
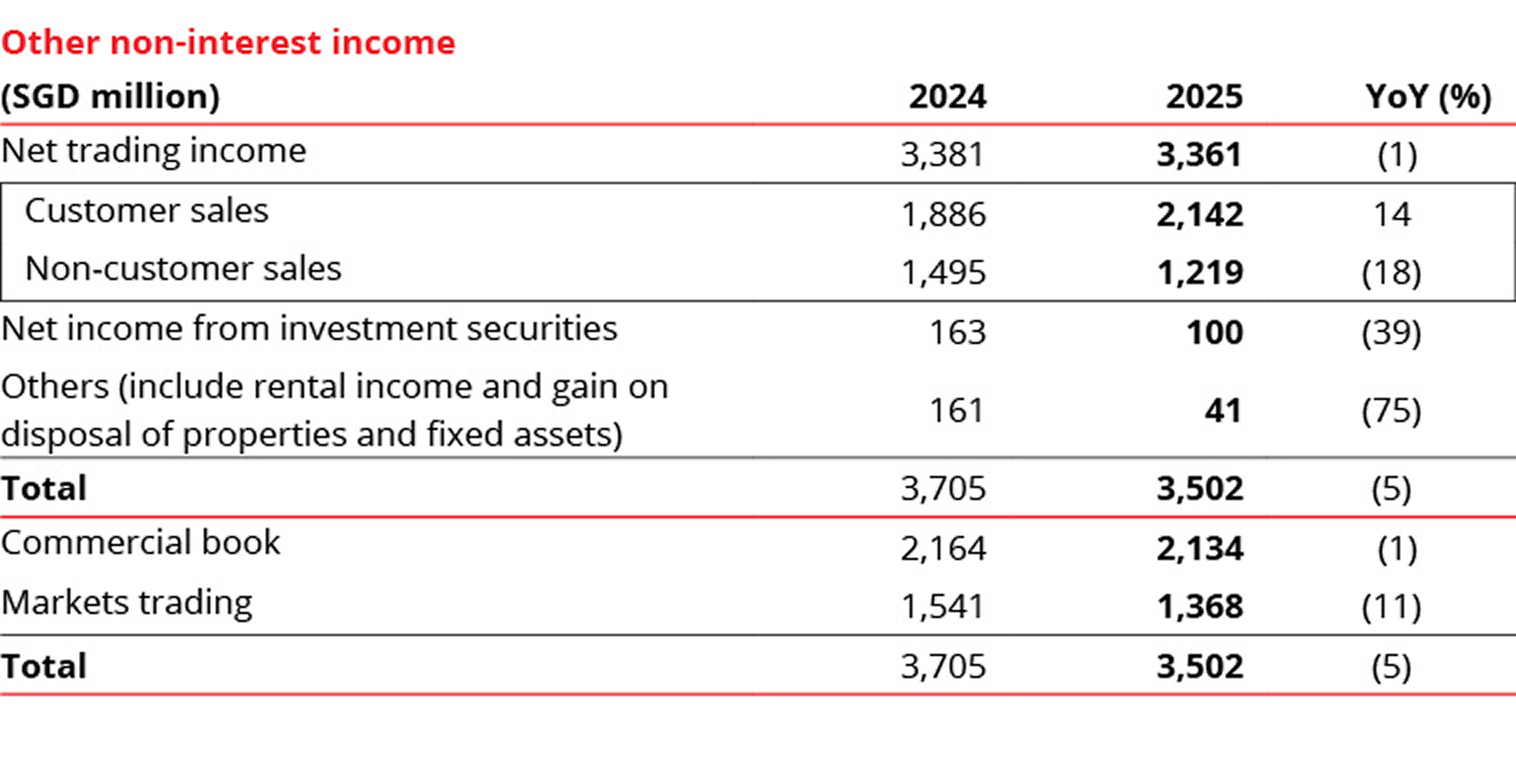
Other non-interest income declined 5% to SGD 3.50 billion as
record treasury customer sales were offset by a decline in non-interest trading income,
lower investment gains and the absence of prior-year non-recurring gains.
(E) Expenses
Expenses rose 4% from a year ago to SGD
9.25 billion led by higher staff costs. The
cost-income ratio was unchanged at 40%.
(F)
Asset quality
Non performing assets declined 4% to SGD 4.84 billion, as new NPA
formation – which included a previously watchlisted real estate exposure prudently
downgraded to NPL in the fourth quarter – was more than offset by upgrades, repayments and
write-offs. The NPL ratio was stable at 1.0%.
Specific allowances amounted to
SGD 854 million or 19 basis points of loans,
broadly in line with the through-cycle
average. General allowances of
SGD 63 million were written back.
Total allowance reserves amounted to
SGD 6.28 billion. Specific allowance
reserves were at SGD 2.42 billion. General
allowance reserves stood at SGD 3.86
billion, which included SGD 2.4 billion of
general allowance overlays. Allowance
coverage was at 130% and at 197% after
considering collateral.

Chng Sok Hui
Chief Financial Officer
DBS Group Holdings