|
 |
 |
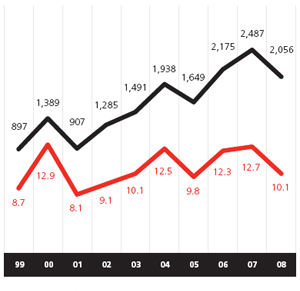
Net Profit ($ millions) |
 |
|
ROE (%) |
|
|
|
|
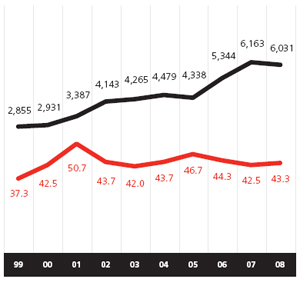
Income ($ millions) |
|
|
Cost-to-Income (%) |
|
|
|
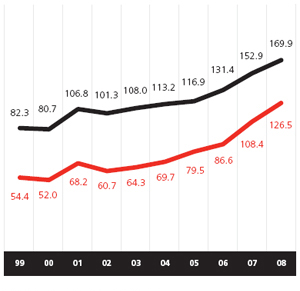
Customer Deposits ($ billions) |
|
|
Customer Loans ($ billions) |
|
|
|
|
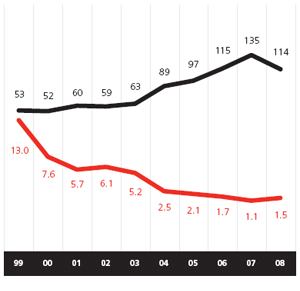
Loss allowance coverage (%) |
|
|
Non-performing loans rate (%) |
|
| |
(1) Excludes one-time items and goodwill charges
(2) Includes financial assets/liabilities at fair value through profit or loss |
|
|