MENU
MENU

We achieved another year of strong operating performance. Total income rose 6% to a record SGD 11.5 billion from sustained growth in a wide range of businesses. Our concerted efforts to digitalise the bank as well as our strategic cost management efforts yielded faster productivity gains, containing expense growth to 1% and improving the cost-income ratio by two percentage points. As a result, profit before allowances increased 10% to a new high of SGD 6.52 billion.
The performance was particularly satisfying because the operating environment was challenging. Unlike the previous year, we did not benefit materially from interest rate and currency movements in 2016. China continued to affect our performance, causing a drag of four percentage points to total income. Our performance was the result of double-digit growth from other businesses as we nimbly captured opportunities in an environment of slower economic growth.
The strong operating results enabled us to absorb a doubling of total allowances as the non-performing loan rate rose from 0.9% to 1.4%, due largely to stresses in the oil and gas support services sector. The higher allowances offset the improved operating performance, resulting in a 2% decline in net profit to SGD 4.24 billion.
The factors contributing to our strong operating performance had one common theme: they were payoffs from investments we had the foresight to make in earlier years and from executing our plans well.
At home, our share of housing loans rose another two percentage points - the same as the previous year - as we offered more stable and attractive pricing packages than competitors could. What enabled us to do so was our stable-cost current and savings deposit base; lacking such a strength, competitors seeking to match our packages would have had to take undue interest rate risks. Despite stiff competition, we maintained our leading share of savings deposits because of the investments we made to enhance the convenience of cash withdrawals and electronic payments for our five million retail customers in Singapore. We captured the increasing prevalence of digital payments as debit and credit card fees rose 11% to SGD 483 million.
Bancassurance income growth accelerated to 60% as we embarked on our regional partnership with Manulife. The 15-year agreement included a payment by Manulife to DBS of SGD 1.6 billion accrued over the period in addition to sales commissions, performance-related commissions and marketing expenses. The attractive terms reflected the potential of the regional bancassurance distribution franchise we built up with investments in technology and headcount. Our share of bancassurance sales in Singapore rose two percentage points from the previous year to 32%, making us the market leader for the first time as we overtook the longstanding incumbent. The strong performance more than offset a decline in unit trust fees from a high year ago base, enabling wealth management fee income to grow 19% to SGD 714 million.
Total cash management income grew 25% to SGD 835 million. The number of new customer mandates accelerated as we progressively added products, including advisory services, to our state-of-the-art digital platform, IDEAL ™, and invested in headcount to provide service excellence. Cash management was a major contributor to the growth of our institutional investor and western MNC customer base, which are target segments.
Investment banking was another growth area as fees rose 15% to SGD 189 million. We maintained our leadership in the Singapore equity and fixed income markets as well as the regional REITs market. We also won several strategic advisory mandates from customers around the region.
Non-trade corporate loans grew 8% to SGD 168 billion. The growth was broad-based across sectors. It included loans to Singapore as well as China companies that were making acquisitions or purchasing assets in developed markets as part of their overseas expansion.
These sources of growth more than offset weakness related to China. Trade loans contracted 5% to SGD 39 billion due to the absence of onshore-offshore RMB arbitrage opportunities. (Trade loans excluding China were stable.) Uncertainty over the direction of the RMB depressed demand for currency hedging products from China and Hong Kong exporters. (We were largely able to make up for the shortfall in other areas, which limited the decline in overall treasury customer income to 3%.)
Interest rate and currency movements provided less benefit than the previous year. Domestic benchmark interest rates used for pricing SGD loans peaked in the first quarter, putting pressure on net interest margin in the second half. As a result, full-year net interest margin rose three basis points to 1.80%, compared to a nine basis point increase in 2015. The USD-SGD exchange rate was stable compared to the positive impact that a 7% depreciation of the SGD had in the previous year.
Our past investments did not only boost the top line: they were instrumental in enabling us to contain expense growth to 1%. Our progress in digitalising the bank and managing costs yielded faster productivity gains during the year. Underlying headcount (excluding staff in certain technology functions that were previously outsourced) fell by 300 staff or 1% as process improvements enabled us to support higher business volumes with fewer resources. The cost-income ratio improved from 45% to 43%.
Our operating performance was better than peer banks. The 6% total income growth we achieved was significantly higher. At the same time, the cost-income ratio was the lowest and the only one to show an improvement.
The resulting 10% rise in profit before allowances provided us with a buffer to absorb a doubling of total allowances. The increase in allowances was due largely to a handful of exposures in the oil and gas support services sector, which was experiencing stresses. In addition, we set aside allowances for several SME customers in Hong Kong and China that had taken hedging positions on the expectation of RMB appreciation.
We continued to maintain a healthy allowance coverage of non-performing assets. On 10 February 2017, we announced that we had sold our stake in DBS China Square Ltd, a subsidiary whose main asset is PWC Building in Singapore. The divestment gains of SGD 350 million, which will be recorded in the first quarter 2017 results, will be set aside as general allowances, raising general allowance reserves to SGD 3.52 billion and allowance coverage to 104%. If collateral was considered, allowance coverage would be at 226%.
We had adequate liquidity to support growth and, during parts of the year, built up additional buffers to meet possible contingencies arising from external circumstances. The loan-deposit ratio was comfortable at 87%. Deposits rose 9% to SGD 347 billion and were supplemented by wholesale funding across a range of tenors. The liquidity coverage ratio in the fourth quarter of the year was 133%, well above the final regulatory requirement of 100% effective 2019. We also met the net stable funding ratio requirement of 100% effective 2018.
Our Basel III fully-phased in Common Equity Tier 1 capital adequacy ratio was 13.3%, well above the final regulatory requirement of 9%, which is more stringent than Basel requirements. Our leverage ratio of 7.7% was more than twice the requirement of 3.0% envisaged by the Basel Committee.
There are changes to the regulatory capital adequacy framework that will be adopted in the near future. They include changes in the standardised approach for measuring counterparty credit risk exposures and the revised market risk framework, which are not expected to increase our risk-weighted assets significantly. The Basel Committee is considering further rule changes but they have yet to be finalised. We will continue to assess the impact of the outstanding regulatory reforms and, if necessary, will manage exposures within our strategy, to help mitigate that impact.
We intend to maintain our existing dividend policy, which is to pay sustainable dividends over time, consistent with our capital management objective, long term growth prospects and the need to maintain prudent capital levels in view of the uncertain impact of regulatory change.
Net book value per share increased 7% to SGD 16.87. The increase was in line with total shareholder returns for the year, comprising a 4% appreciation in the share price and a dividend payout of 60 cents per share. DBS had a market capitalisation of SGD 44.0 billion at 31 December 2016.
Last year, I outlined the preparations we were making for implementing Financial Reporting Standard (FRS) 109, which will take effect in 2018. Among other things, the new accounting standard governs how Singapore reporting entities take allowance charges. At present, Singapore banks comply with MAS Notice 612, under which they maintain, in addition to specific allowances, a prudent level of general allowances of at least 1% of uncollateralised credit exposures. This is an intended departure from the incurred loss approach prescribed under FRS 39.
We will be able to quantify the impact of FRS 109, including its effect on capital requirements, when there is clarity on changes to current regulatory specifications. We expect to be able to do so by next year's annual report. At this juncture, our view remains that any such changes are unlikely to result in additional allowance charges for DBS at the point of adoption.
Read more about FRS 109 in the Risk Management report on page 102.
The coming year is likely to continue to be challenging. Geopolitical uncertainty and policy direction of the US and China will have a bearing on Asia's economic growth. At the same time, although we are not seeing signs of stress in our portfolio outside of oil and gas support services, we remain vigilant on asset quality.
We have strong foundations to meet the challenges. The financial discipline we exercised over the years in building up buffers for capital, liquidity and allowance reserves has ensured that our balance sheet remains resilient. We have continued momentum in a broad range of businesses from cash management to wealth management. Higher interest rates will be a net positive for us. While stresses in the oil and gas support services sector could persist, new NPL formation and specific allowances for the sector are expected to be lower than in 2016. Finally, the speedy integration of the retail and wealth management businesses of ANZ announced in October 2016 will provide additional support to income and earnings in 2017.
Net interest income increased 3% to a record SGD 7.31 billion.

Net interest margin was three basis points higher at 1.80%. Higher domestic interbank and swap
offer
rates in the first quarter boosted Singapore-dollar loan yields.
These benefits were largely offset by a decline in benchmark Singapore-dollar interest rates
from
the second quarter. As a result, a rising net interest margin in the
first half gave way to a decline in the second half.
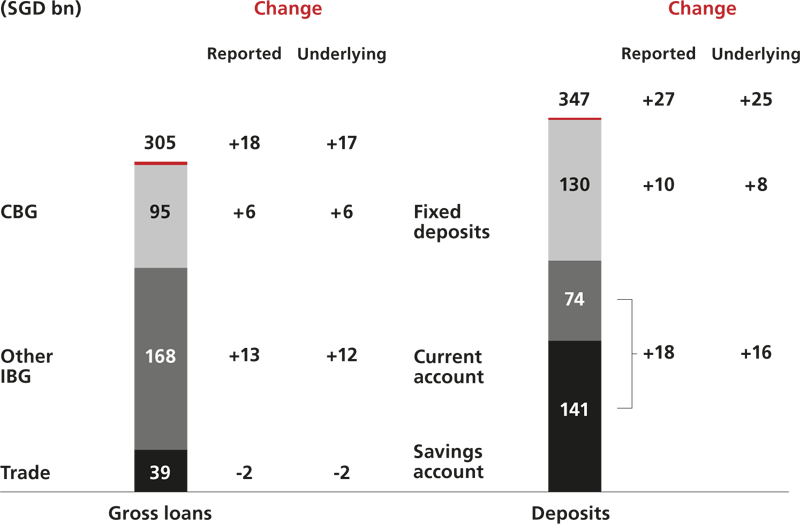
Gross loans grew 6% to SGD 305 billion. Non-trade corporate loans expanded 8% as customers from across the region borrowed for a wide range of activities. Market share gains resulted in an 11% growth in Singapore housing loans. These increases more than offset a 5% decline in trade loans due to China. Trade loans excluding China were stable.
Deposits rose 9% to SGD 347 billion. Savings and current accounts accounted for the majority of the increase in line with efforts to grow transactional accounts.

Net fee income increased 9% to a new high of SGD 2.33 billion. The growth was broad-based. Wealth management fees rose 19% as a 60% increase in bancassurance fees more than offset a decline in fees from unit trusts due to a high year-ago base. Card fees grew 11% from increased credit and debit card transactions in Singapore. Investment banking fees were 15% higher from stronger advisory and equity underwriting activities. A 12% increase in cash management fees more than offset a decline in trade finance fees, resulting in a 5% increase in transaction banking fees.

Other non-interest income grew 19% to SGD 1.85 billion. Trading income rose 13% as an increase in trading gains and wealth management customer treasury income was partially offset by lower corporate customer treasury income. An increase in net gain on investment securities was partially offset by lower gains on fixed assets.

By business unit, total income from Consumer Banking / Wealth Management rose 21% to SGD 4.28 billion. The growth was broad-based across loans, deposits, bancassurance and cards. Income from the Wealth Management customer segment increased 19% to SGD 1.68 billion as assets under management grew 14% to SGD 166 billion, putting DBS among the top five banks in the Asia Pacific. Institutional Banking income was little changed at SGD 5.22 billion. Growth in income from cash management, loan activities and capital markets was offset by declines in trade finance and treasury customer income due to uncertainty related to China and the RMB. Treasury segment income was also stable at SGD 1.13 billion.
By geography, Singapore total income increased 13% to SGD 7.54 billion from higher net interest income and from a wide range of non-interest income activities. Hong Kong income declined 8% to SGD 2.10 billion as uncertainty related to China affected trade and treasury customer income. Rest of Greater China income fell 19% to SGD 834 million from a lower net interest margin and lower treasury customer income. South and Southeast Asia income increased 28% to SGD 717 million. Net interest income rose from loan growth, while fee and trading income were also higher.
Expenses increased 1% to SGD 4.97 billion. The cost-income ratio improved from 45% to 43% as we yielded faster productivity gains from digitalisation and strategic cost management.

There was strong growth in the digital acquisition of customers at lower unit costs. We also drove more transactions and execution towards digital channels, which had lower cost to serve compared to traditional channels. We had higher straight-through processing, which reduced or eliminated the amount of manual inputs and paperwork for an increasing number of mid- and back-office functions. This enabled us to process higher business volumes with fewer resources, improving operating leverage as additional income earned flowed to the bottom line.
At the same time, a strategic cost management programme initiated in 2012 continued to deliver savings by identifying new ways to streamline more processes, leverage new technology and manage sourcing costs.
One outcome of the productivity gains was a decline in underlying headcount of 300 over the past year even as business volumes expanded.
Non-performing assets increased 74% to SGD 4.86 billion. The increase was due largely to stresses in the oil and gas support services sector. It also included exposures to Hong Kong and China exporters that had taken RMB hedging positions. Total allowances doubled to SGD 1.43 billion.
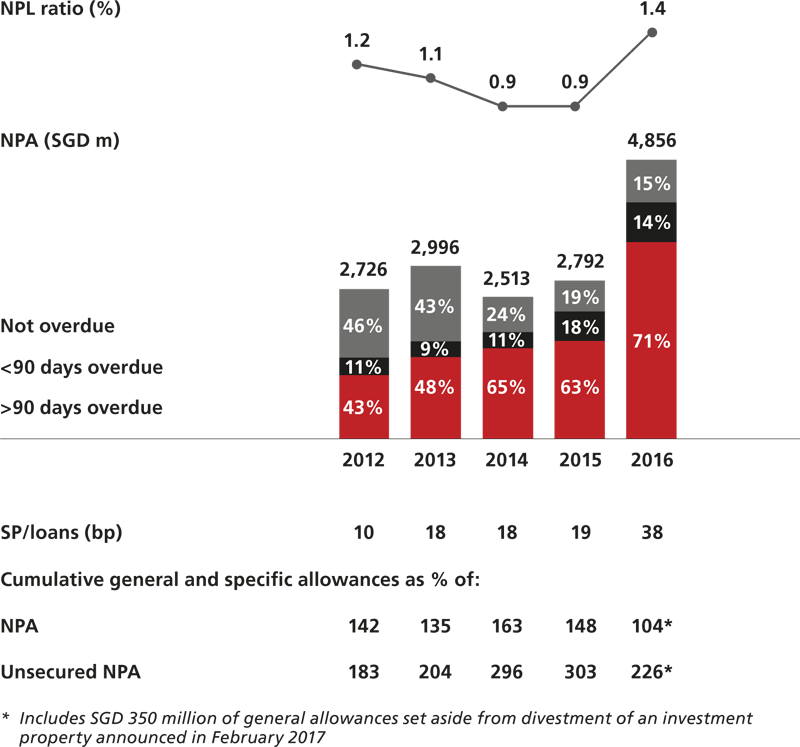
Allowance coverage remained healthy. The gains of SGD 350 million from an investment property divestment announced in February 2017 will be set aside as general allowances. To be recorded in the first quarter 2017 results, they will raise general allowance reserves to SGD 3.52 billion and allowance coverage to 104%. If collateral was considered, allowance coverage would be at 226%.